Set up docs MCP
Prerequisites:
- Familiarity with ClickHouse config files
- A running instance of ClickHouse server
- (Optional) A running local Grafana instance
[object Object]
If you have not made any modifications to the opentelemetry_span_log section of config.xml you can skip this step.
Open your default ClickHouse config.xml file and find the following section:
<!--
    OpenTelemetry log contains OpenTelemetry trace spans.

    NOTE: this table does not use standard schema with event_date and event_time!
-->
<opentelemetry_span_log>
    <!--
        The default table creation code is insufficient, this <engine> spec
        is a workaround. There is no 'event_time' for this log, but two times,
        start and finish. It is sorted by finish time, to avoid inserting
        data too far away in the past (probably we can sometimes insert a span
        that is seconds earlier than the last span in the table, due to a race
        between several spans inserted in parallel). This gives the spans a
        global order that we can use to e.g. retry insertion into some external
        system.
    -->
    <engine>
        engine MergeTree
        partition by toYYYYMM(finish_date)
        order by (finish_date, finish_time_us, trace_id)
    </engine>
    <database>system</database>
    <table>opentelemetry_span_log</table>
    <flush_interval_milliseconds>7500</flush_interval_milliseconds>
    <max_size_rows>1048576</max_size_rows>
    <reserved_size_rows>8192</reserved_size_rows>
    <buffer_size_rows_flush_threshold>524288</buffer_size_rows_flush_threshold>
    <flush_on_crash>false</flush_on_crash>
</opentelemetry_span_log>
Make sure that it is not commented out, or else you won’t be able to see system.opentelemetry_span_log in the following steps.
This can also be the case if your ClickHouse server is not using the default configuration file.
Check your server logs for something like:
Processing configuration file 'config.xml'.
There is no file 'config.xml', will use embedded config.Enable OpenTelemetry tracing
With your ClickHouse server running, open ClickHouse client and enable trace collection using the following query:
SET opentelemetry_trace_processors=1;You should now see the opentelemetry_span_log system table if you run:
SHOW TABLES IN systemNext run:
SET opentelemetry_start_trace_probability=1;This sets the probability that the ClickHouse can start a trace for executed queries, where
1 means that the trace is enabled for all executed queries.
Obtain a query ID
Run the following dummy query, or the query you are interested in tracing:
SELECT pow(number, 2) FROM numbers(10E4);Copy the query id:
:) SELECT pow(number, 2) FROM numbers(10E4);

SELECT pow(number, 2)
FROM numbers(100000.)

Query id: a9241258-a0c4-4776-a00b-e6a1d9bec4a1
Generate a trace file
Run the following query, substituting in the query ID you obtained in the previous step:
WITH 'a9241258-a0c4-4776-a00b-e6a1d9bec4a1' AS my_query_id
SELECT
    concat(substring(hostName(), length(hostName()), 1), leftPad(greatest(attribute['clickhouse.thread_id'], attribute['thread_number']), 5, '0')) AS group,
    operation_name,
    start_time_us,
    finish_time_us,
    sipHash64(operation_name) AS color,
    attribute
FROM system.opentelemetry_span_log
WHERE (trace_id IN (
    SELECT trace_id
    FROM system.opentelemetry_span_log
    WHERE (attribute['clickhouse.query_id']) = my_query_id
)) AND (operation_name != 'query') AND (operation_name NOT LIKE 'Query%')
ORDER BY
    hostName() ASC,
    group ASC,
    parent_span_id ASC,
    start_time_us ASC
INTO OUTFILE 'trace.json'
FORMAT JSON
SETTINGS output_format_json_named_tuples_as_objects = 1
This will write the trace to a file named trace.json.
By default, this file is created in the current working directory from which you are running the clickhouse-client or clickhouse-local tool.
Visualize trace using built-in tooling
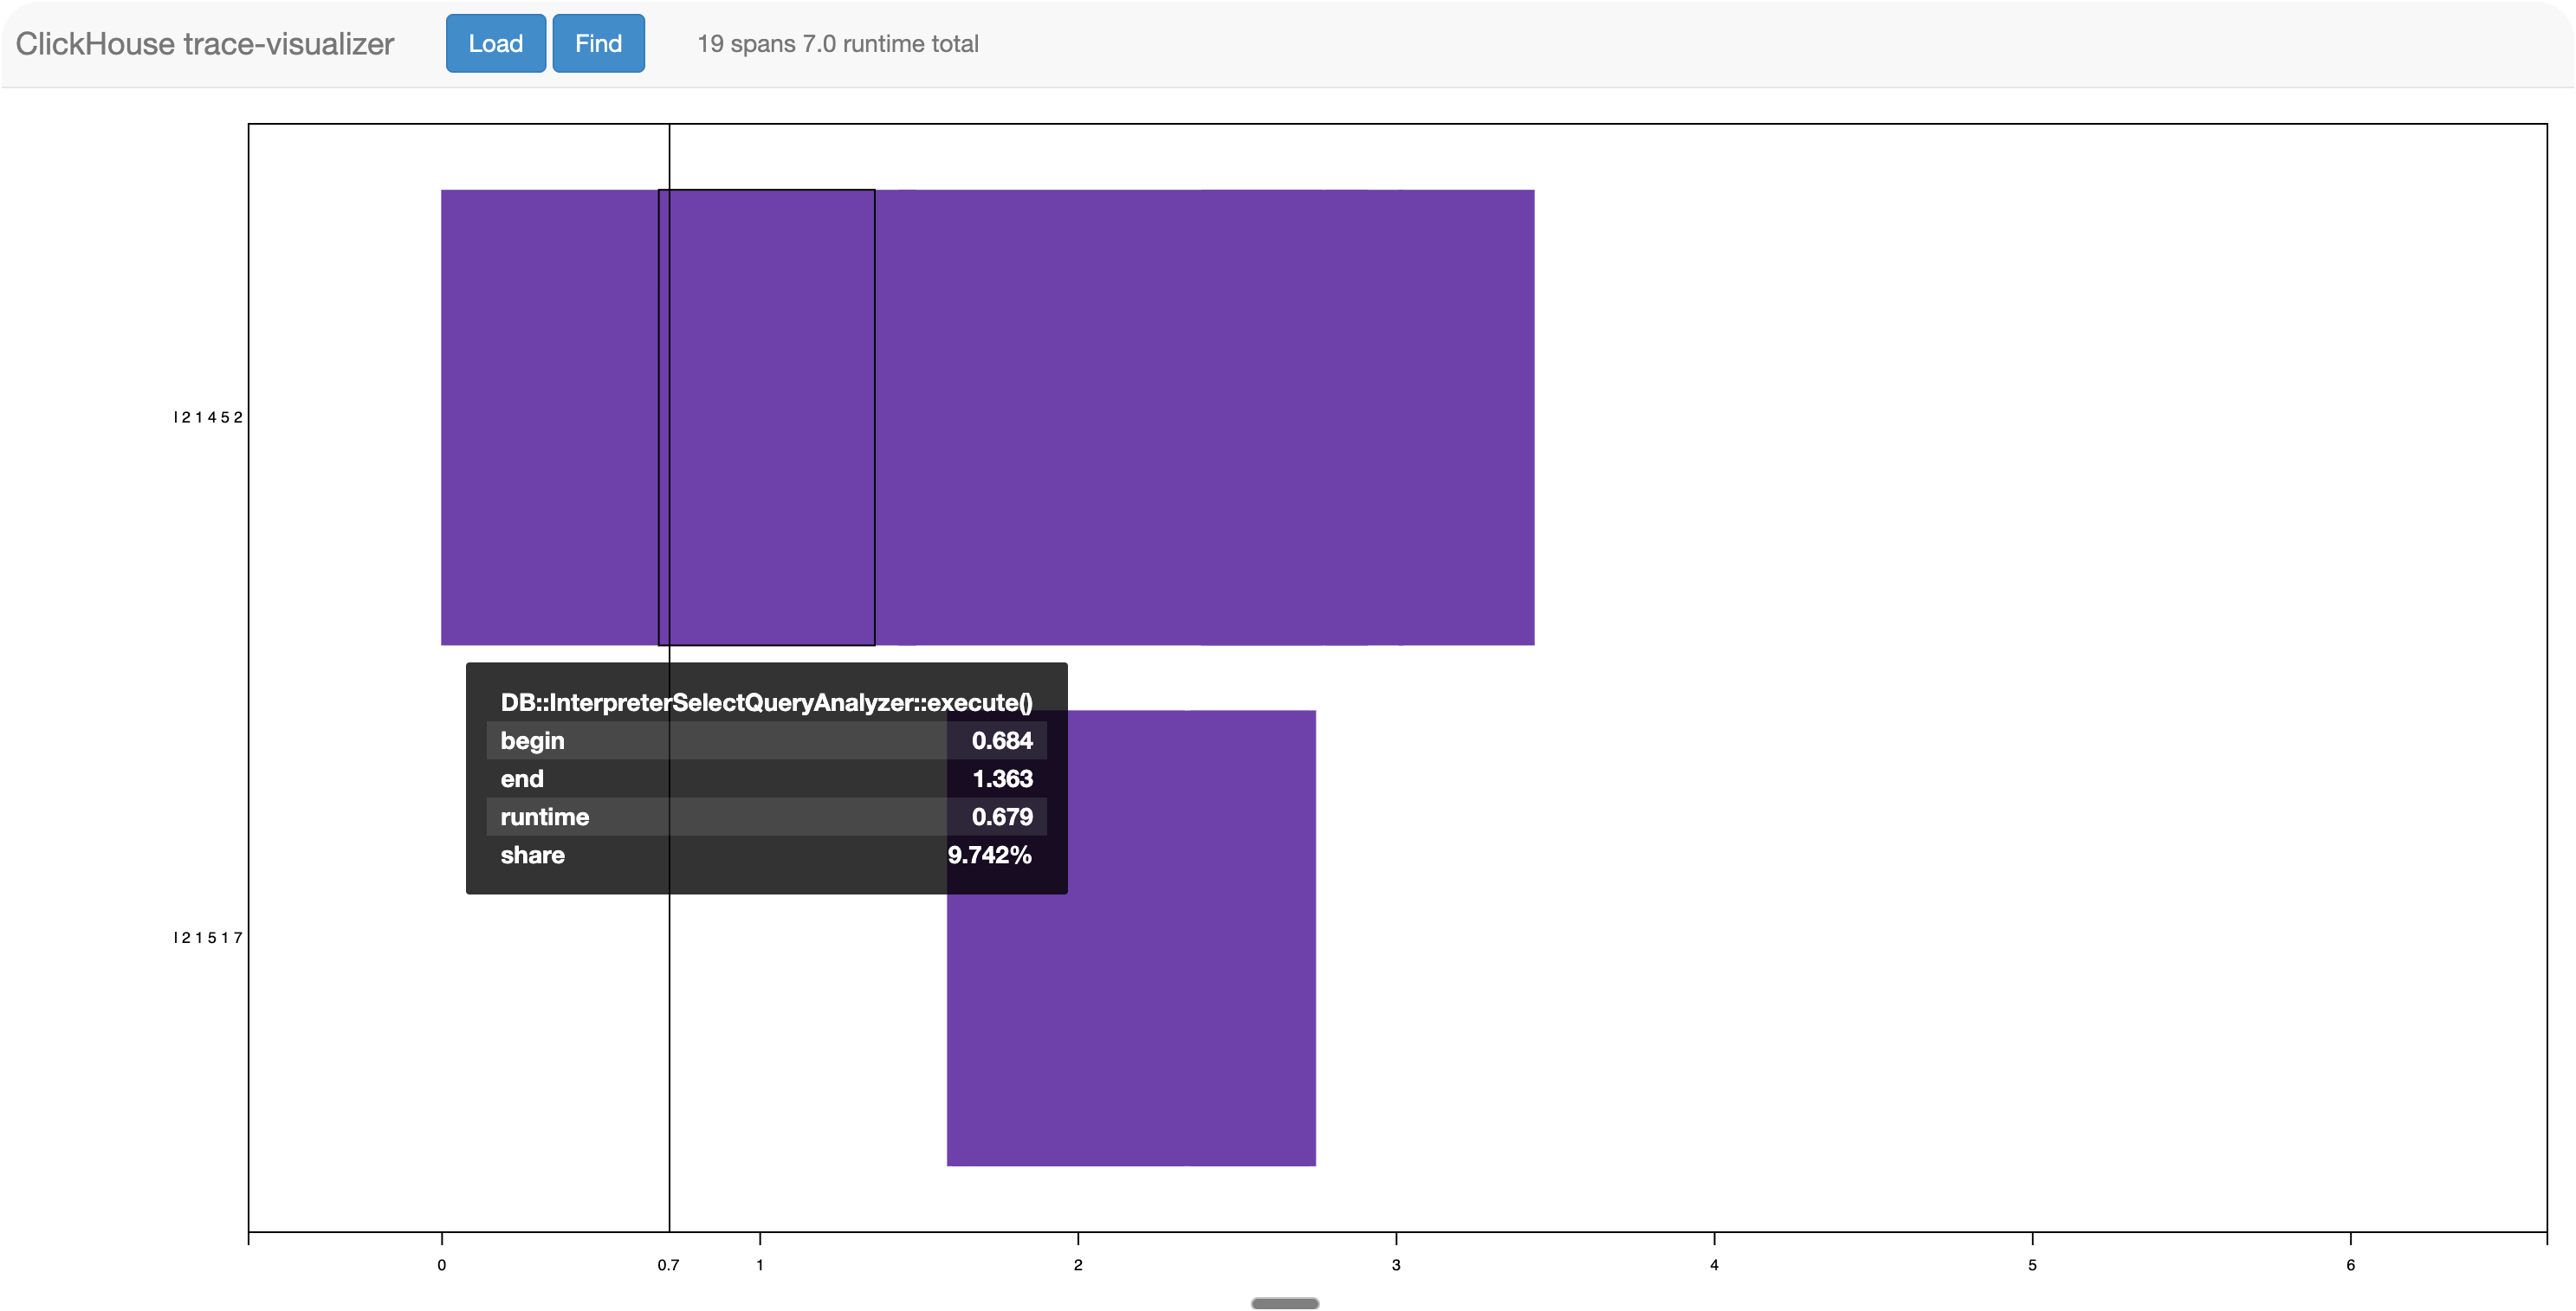
Use the hosted trace visualizer at https://trace-visualizer.clickhouse.com/.
Load the trace.json file from the previous step to visualize the trace.
Using Grafana to visualize traces
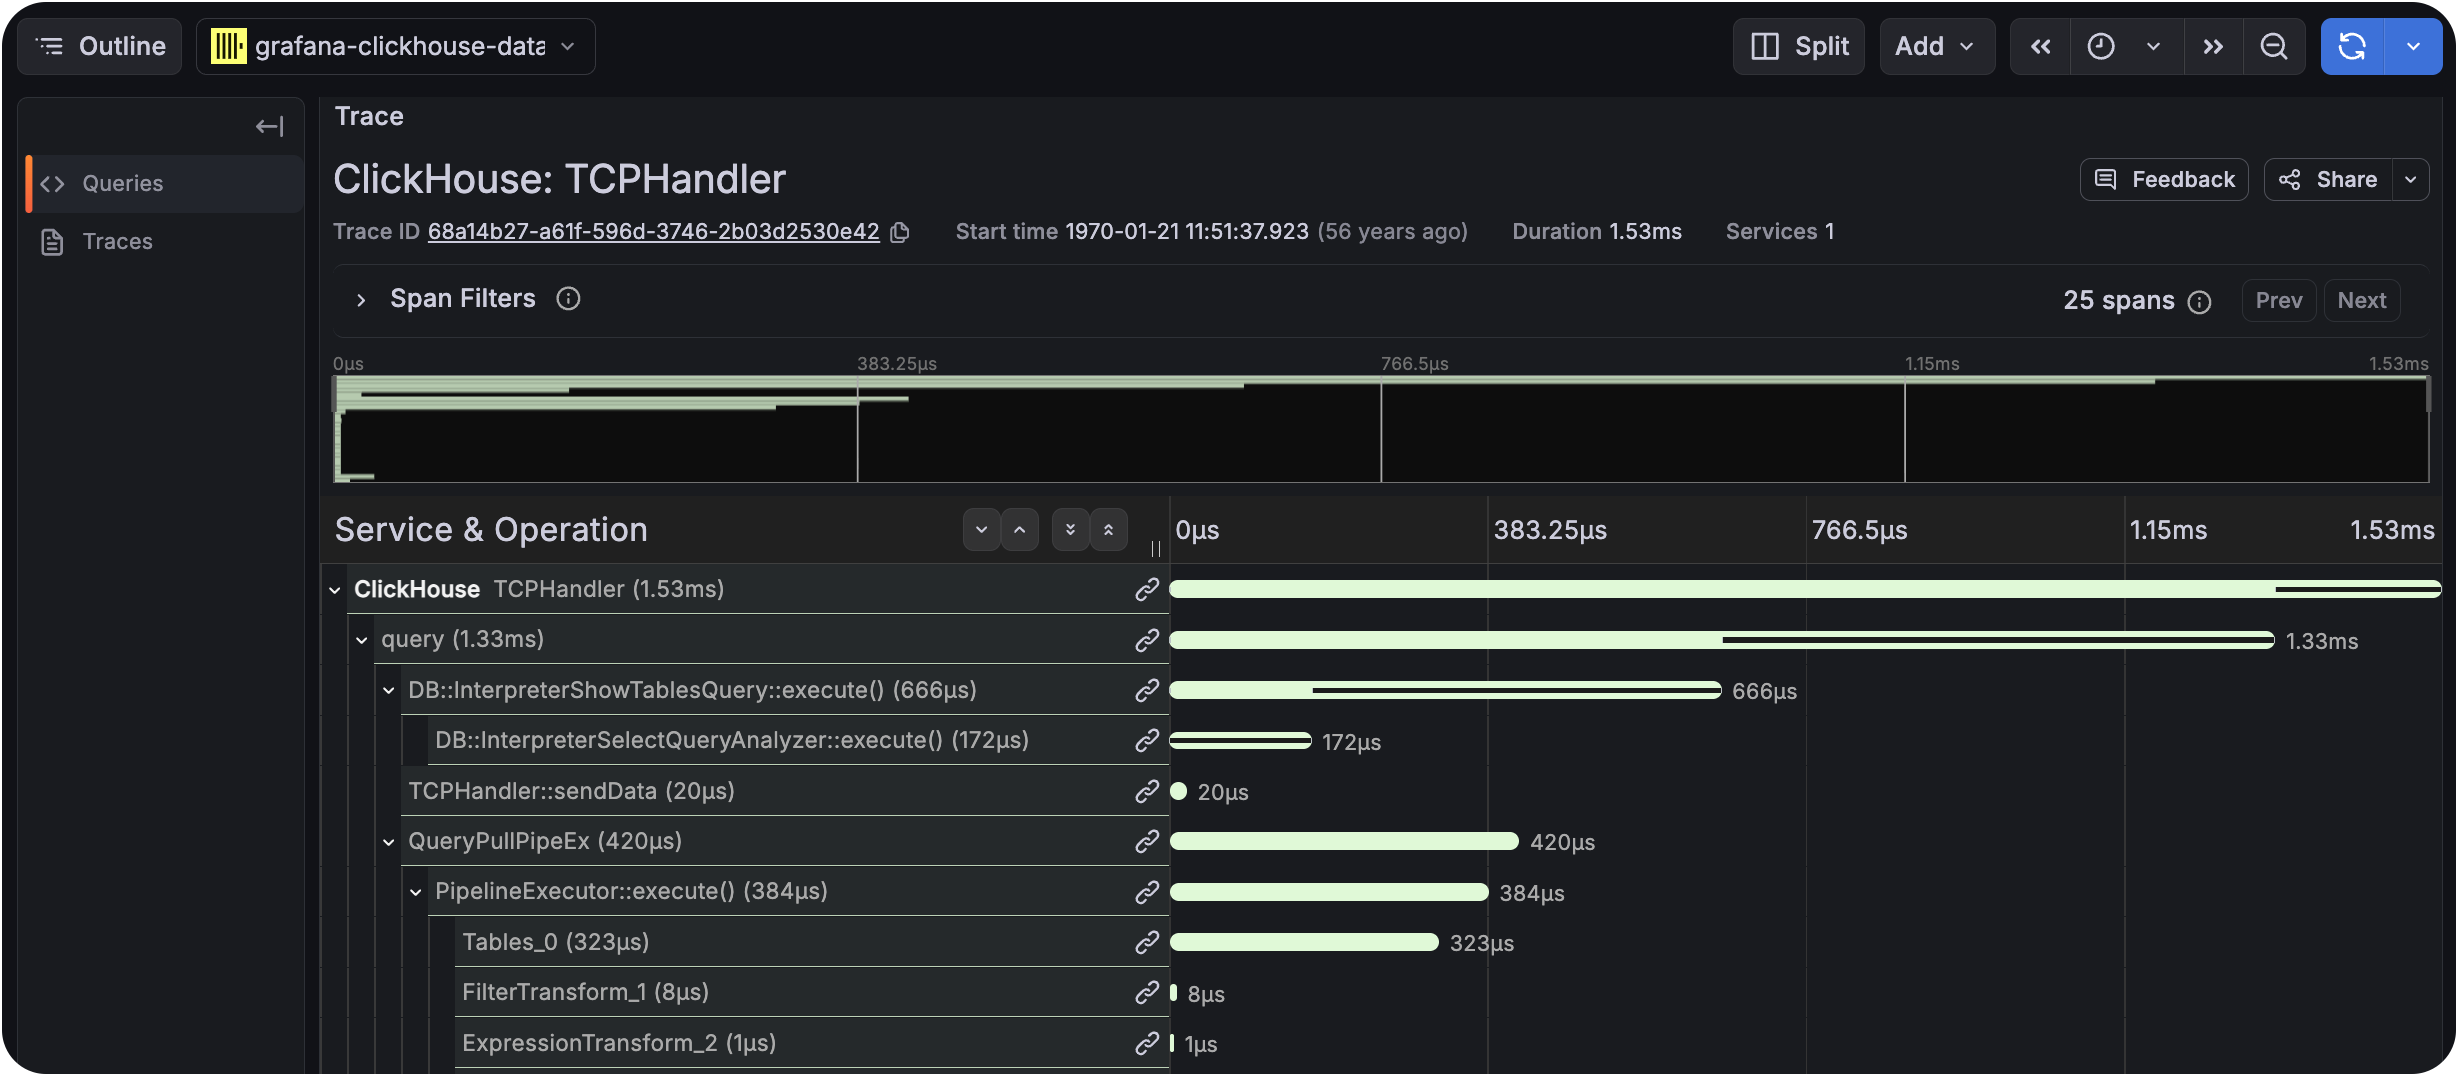
We recommend Grafana for visualizing and exploring trace data using the official ClickHouse plugin. The plugin has been enhanced to allow visualization of traces using the Trace Panel. This is supported as both a visualization and as a component in Explore.
Follow the steps described in “Using Grafana and ClickHouse for Observability” to set up Grafana with the ClickHouse plugin.
From the Explore tab you can then run the following query, replacing the trace_id with your own:
SELECT
    toString(trace_id) AS traceID,
    toString(span_id) AS spanID,
    if(toString(parent_span_id)='0', '', toString(parent_span_id)) AS parentSpanID,
    'ClickHouse' AS serviceName,
    operation_name AS operationName,
    start_time_us/1000000 AS startTime,
    (finish_time_us - start_time_us)/1000 AS duration,
    arrayMap(key -> map('key', key, 'value', attribute[key]), mapKeys(attribute)) AS serviceTags
FROM system.opentelemetry_span_log
WHERE trace_id = '68a14b27-a61f-596d-3746-2b03d2530e42' ORDER BY startTime ASC
Make sure to set Query type to Traces:
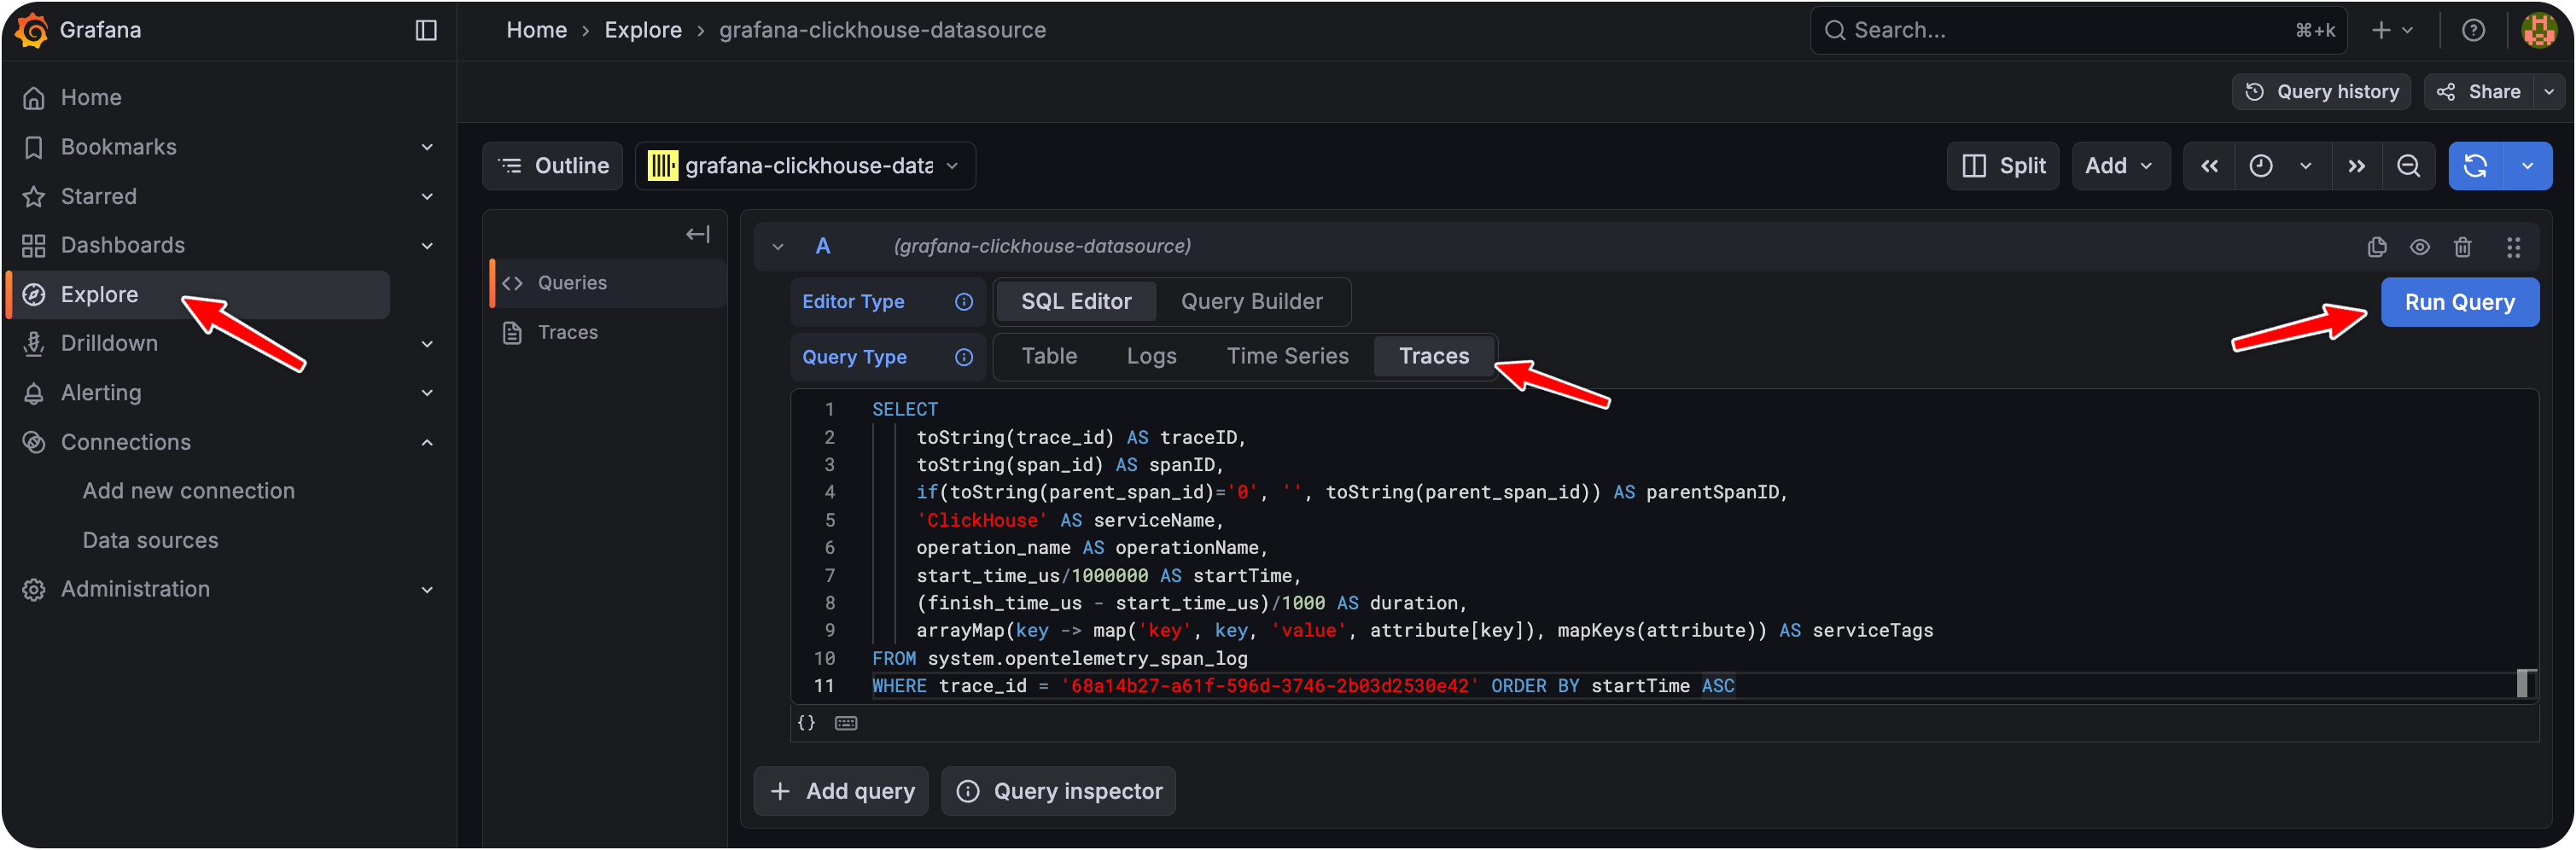
Click “Run Query” and inspect the trace diagram: