

 Set up docs MCP
The HackerNews Analyzer is a Node.js app that queries the HackerNews dataset hosted in the public ClickHouse demo. Every chart, table, and search box is a real ClickHouse query, so every interaction produces a trace whose main span is the HTTPS call from the backend out to ClickHouse.
This is a different job from the session replay demo, which instruments a browser-only app against local Docker ClickStack. Here you get backend auto-instrumentation, ClickHouse query spans, and session replay from the same app.
Prerequisites
- Node 18+ and npm
- A ClickStack OTLP/HTTP endpoint and ingestion token:
- ClickHouse Cloud: open the service, then ClickStack → Configure your OpenTelemetry exporter → Env vars. Protocol is
http/protobuf. Headers areauthorization=<ingestion token>with noBearerprefix. - Local collector: use
http://localhost:4318. If the collector is unsecured, leaveauthorization=empty.
- ClickHouse Cloud: open the service, then ClickStack → Configure your OpenTelemetry exporter → Env vars. Protocol is
Clone the repository
Clone HackerNews Analyzer, install dependencies, and copy the env template:
git clone https://github.com/ClickHouse/hn-news-analyzer.git
cd hn-news-analyzer
npm install
cp .env.example .env
You’ll fill .env in the next steps, then instrument from this directory.
Instrument the application
Run the application
From the cloned hn-news-analyzer directory, start the app. The ClickHouse data source defaults to the public read-only demo cluster, so it runs without any further configuration:
./run.shOpen http://localhost:5001. You will see a year selector, summary statistics, an activity chart, top users and domains tables, and a search box. Click around: switch years, drill into stories.
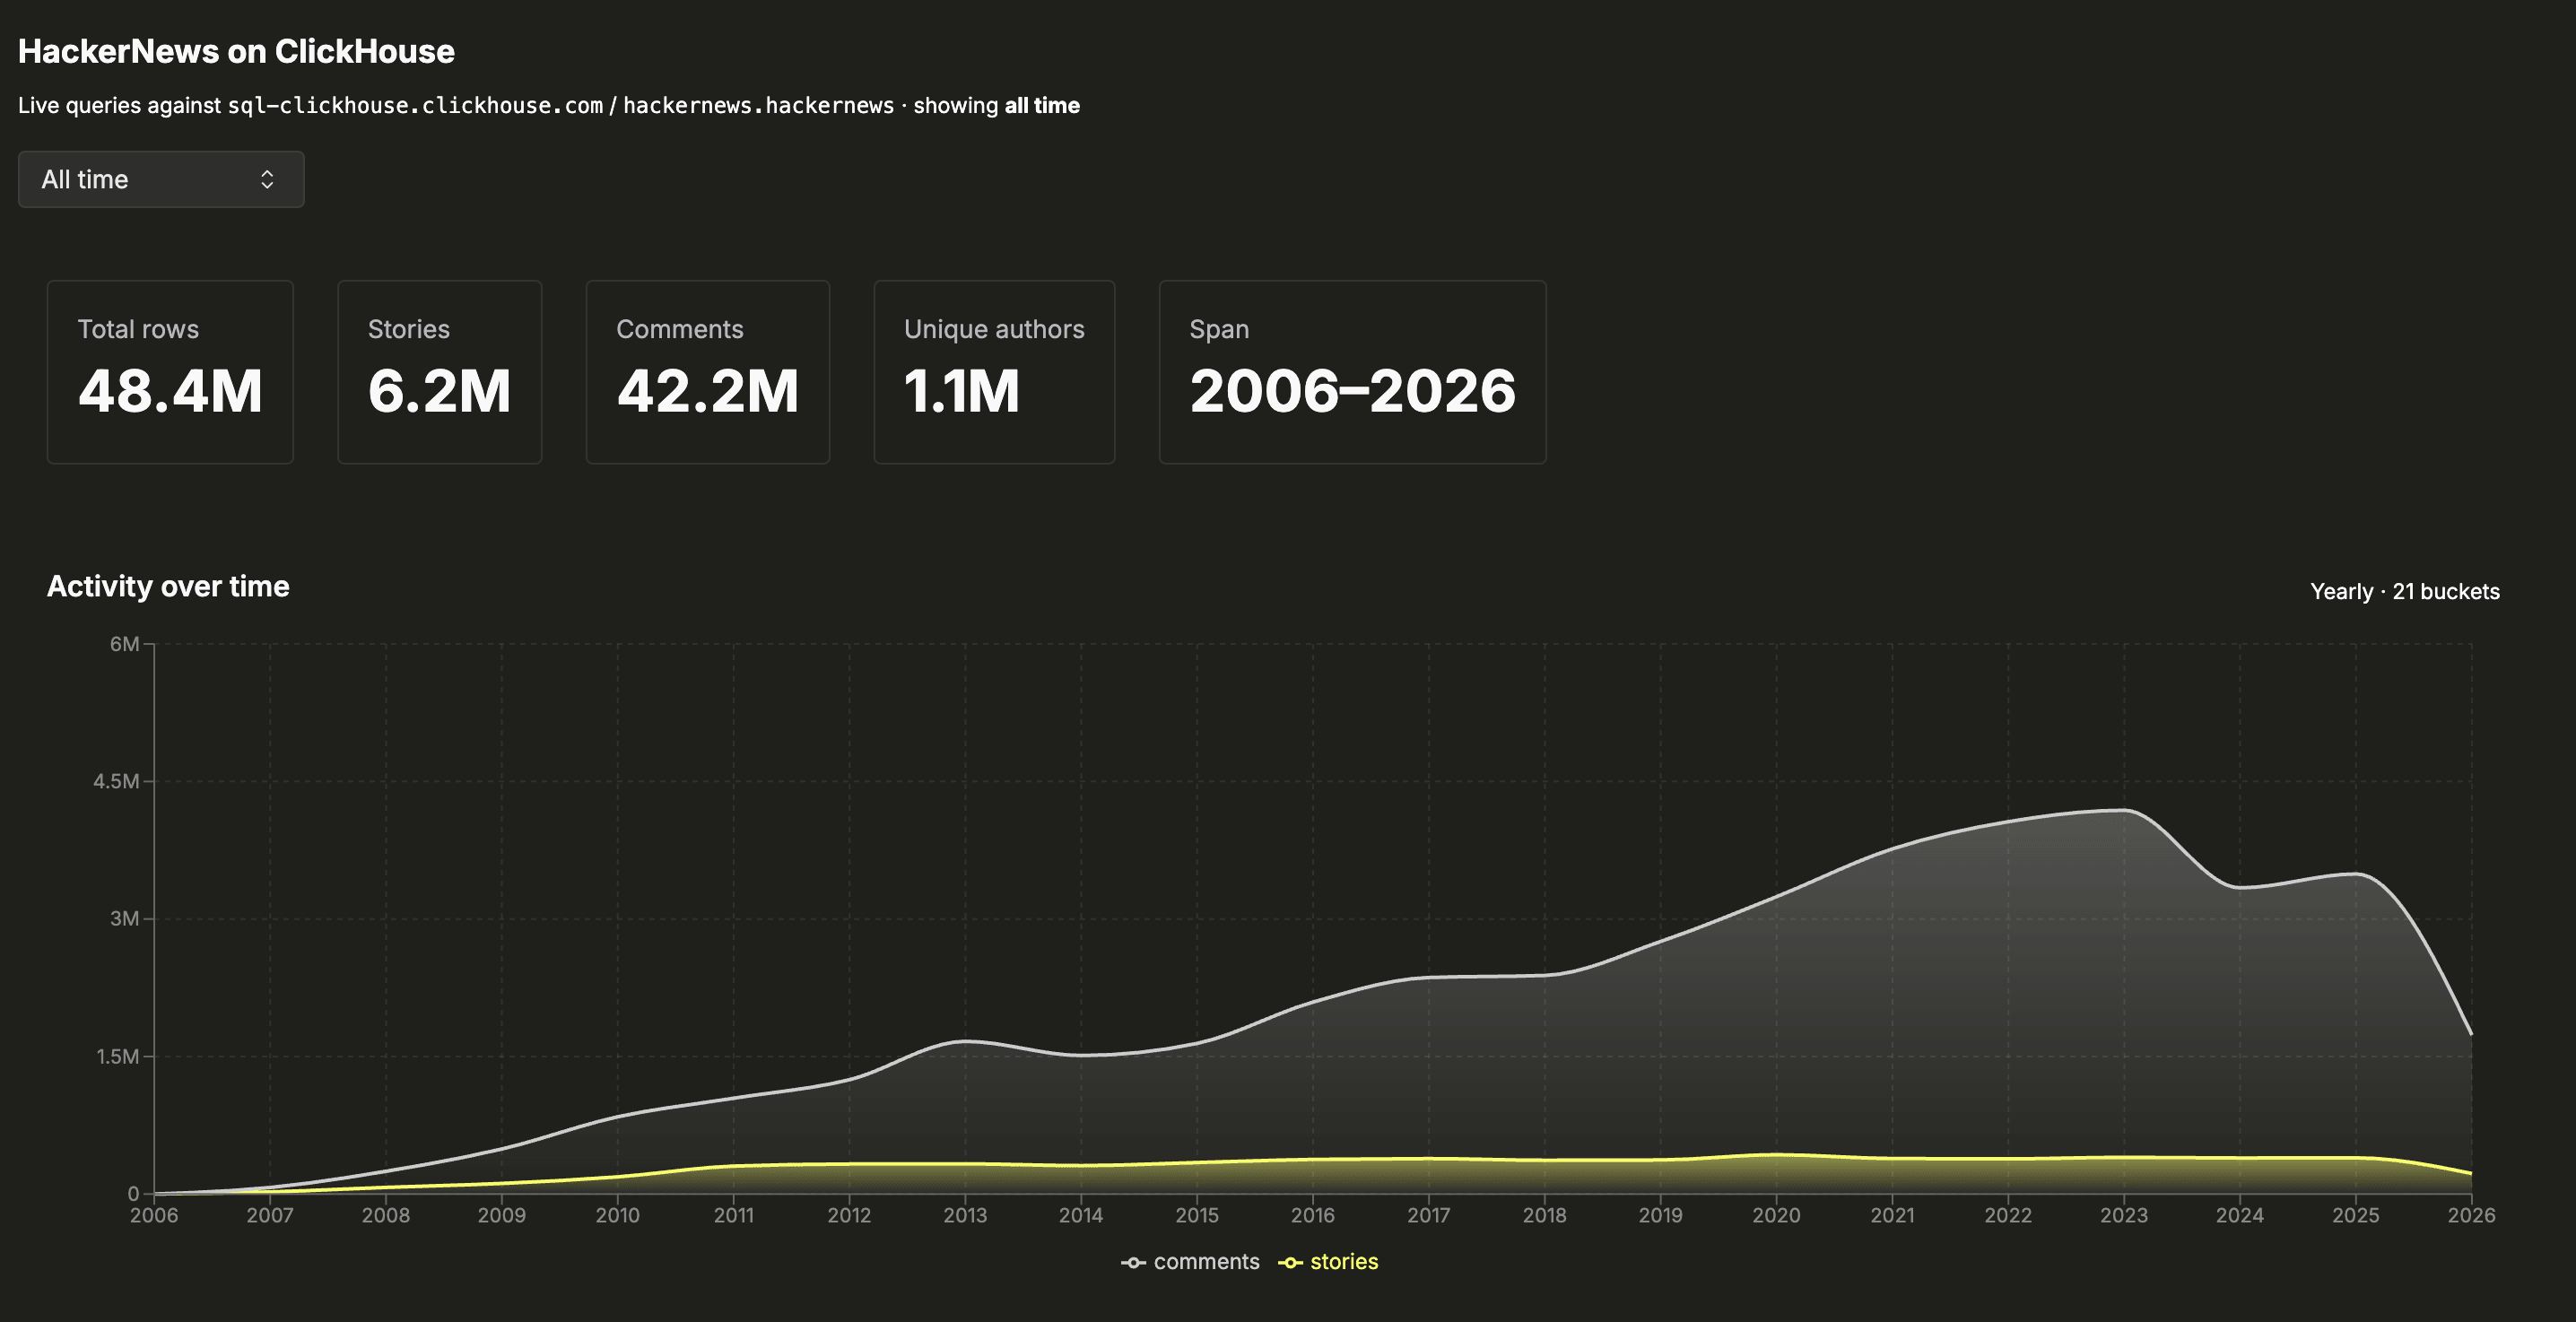
At this point the application is running but uninstrumented. ClickStack shows no data: it is waiting for telemetry.
Configure environment
The SDKs read standard OpenTelemetry exporter variables. They are not hardcoded in source. Open .env and set:
OTEL_SERVICE_NAME=hn-analyzer-api
OTEL_EXPORTER_OTLP_ENDPOINT=<your-otlp-http-endpoint>
OTEL_EXPORTER_OTLP_PROTOCOL=http/protobuf
OTEL_EXPORTER_OTLP_HEADERS=authorization=<your-ingestion-token>
OTEL_TRACES_EXPORTER=otlp
OTEL_METRICS_EXPORTER=otlp
OTEL_LOGS_EXPORTER=otlp
OTEL_EXPORTER_OTLP_ENDPOINT is the OTLP/HTTP endpoint (port 4318). OTEL_EXPORTER_OTLP_HEADERS is the authorization header, in the form authorization=<token> with no Bearer prefix.
If the collector does not enforce auth, leave the token empty (OTEL_EXPORTER_OTLP_HEADERS=authorization=). The variable must still be present; the SDK skips initialization if it is unset or fully empty.
The browser SDK reuses these same values. vite.config.ts bakes the endpoint and token into the public bundle at build time, so use a throwaway ingestion token, not a production one.
Instrument the application
Pick one path. All three end at the same instrumented app.
With the repo cloned and .env filled in, paste this prompt into a coding agent in that directory to instrument the application.
What the agent will do
- Confirm you are in the cloned hn-news-analyzer directory and that .env already has OTEL_EXPORTER_OTLP_* values. Stop if either is missing.
- Install @hyperdx/node-opentelemetry and switch run.sh to opentelemetry-instrument.
- Install @hyperdx/browser and enable HyperDX.init plus HyperDX.addAction.
- Start the app, confirm OTLP health checks pass, and tell you to click around at http://localhost:5001.
Instrumentation has three parts: install the SDKs, switch the launch command, and enable the browser SDK. None of it changes the application’s business logic.
Install the Node SDK
npm install @hyperdx/node-opentelemetryEnable the wrapper in run.sh
The bottom of run.sh has two exec lines. Comment the plain node line and uncomment the instrumented one:
 # BEFORE: plain node, no instrumentation:
-exec node scripts/entrypoint.js
+# exec node scripts/entrypoint.js

 # AFTER: same source, wrapped by opentelemetry-instrument:
-# exec npx opentelemetry-instrument scripts/entrypoint.js
+exec npx opentelemetry-instrument scripts/entrypoint.js
Keep launching through scripts/entrypoint.js. That shim calls require('console') so console capture wraps console.log. Pointing opentelemetry-instrument at dist/server/index.js directly ships traces but silently drops logs.
Enable the browser SDK
npm install @hyperdx/browserIn src/web/telemetry.ts, uncomment the import, the HyperDX.init({...}) block, and HyperDX.addAction in recordAction():
-// import HyperDX from '@hyperdx/browser';
+import HyperDX from '@hyperdx/browser';

 export function initTelemetry(): void {
-  // HyperDX.init({
-  //   url: __OTLP_ENDPOINT__,
-  //   apiKey: __OTLP_AUTH_TOKEN__,
-  //   service: 'hn-analyzer-web',
-  //   tracePropagationTargets: [/localhost:5001/i, /\/api\//i],
-  //   consoleCapture: true,
-  //   advancedNetworkCapture: true,
-  // });
+  HyperDX.init({
+    url: __OTLP_ENDPOINT__,
+    apiKey: __OTLP_AUTH_TOKEN__,
+    service: 'hn-analyzer-web',
+    tracePropagationTargets: [/localhost:5001/i, /\/api\//i],
+    consoleCapture: true,
+    advancedNetworkCapture: true,
+  });
 }
__OTLP_ENDPOINT__ and __OTLP_AUTH_TOKEN__ are compile-time constants injected by vite.config.ts from the same OTEL_EXPORTER_OTLP_* values the backend uses.
To skip instrumentation and start with an already instrumented application, check out the instrumented branch.
git checkout instrumented
npm install
Don’t run ./reset.sh on this branch unless you want to strip the SDKs.
Generate traffic and view telemetry
Restart the application so the new launch command and freshly built browser bundle take effect:
# Ctrl-C the previous run, then:
./run.sh
Confirm the startup banner prints three “Health check passed” lines for /v1/traces, /v1/metrics, and /v1/logs. Reload the browser tab so Vite serves the updated bundle, then switch years and click into stories to generate traffic.
Open the ClickStack UI:
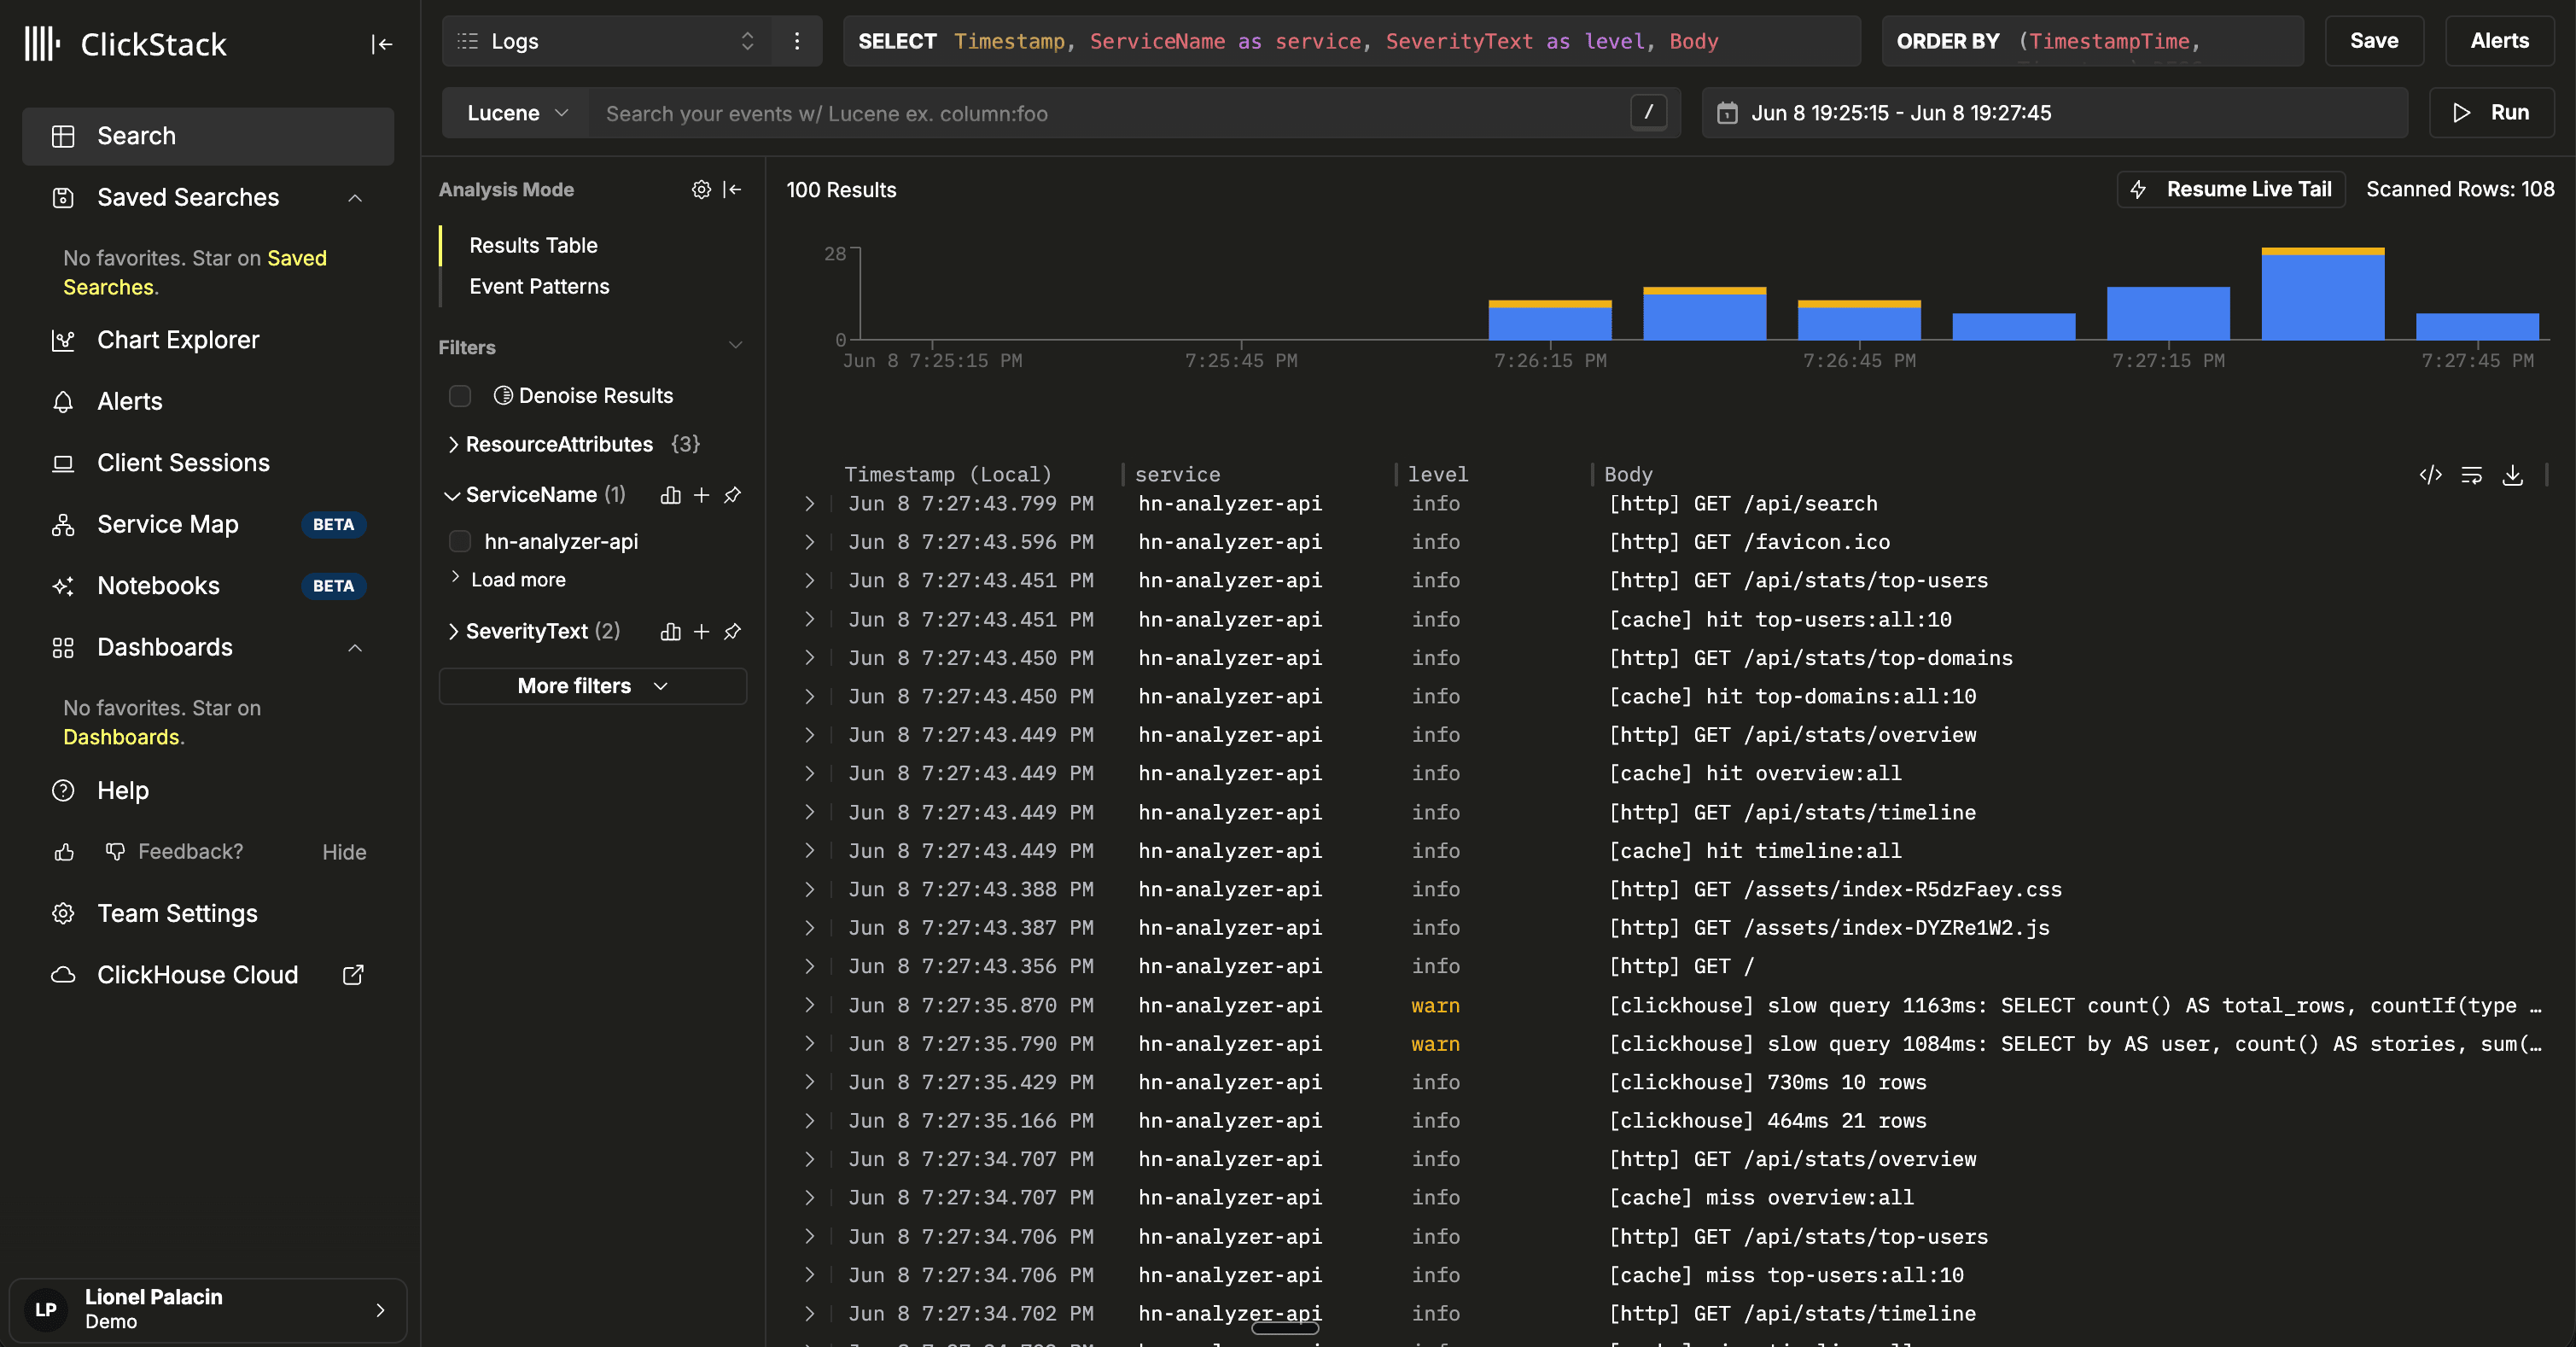
- Go to Search and filter to the last 5 minutes. Logs for
hn-analyzer-apistream in.
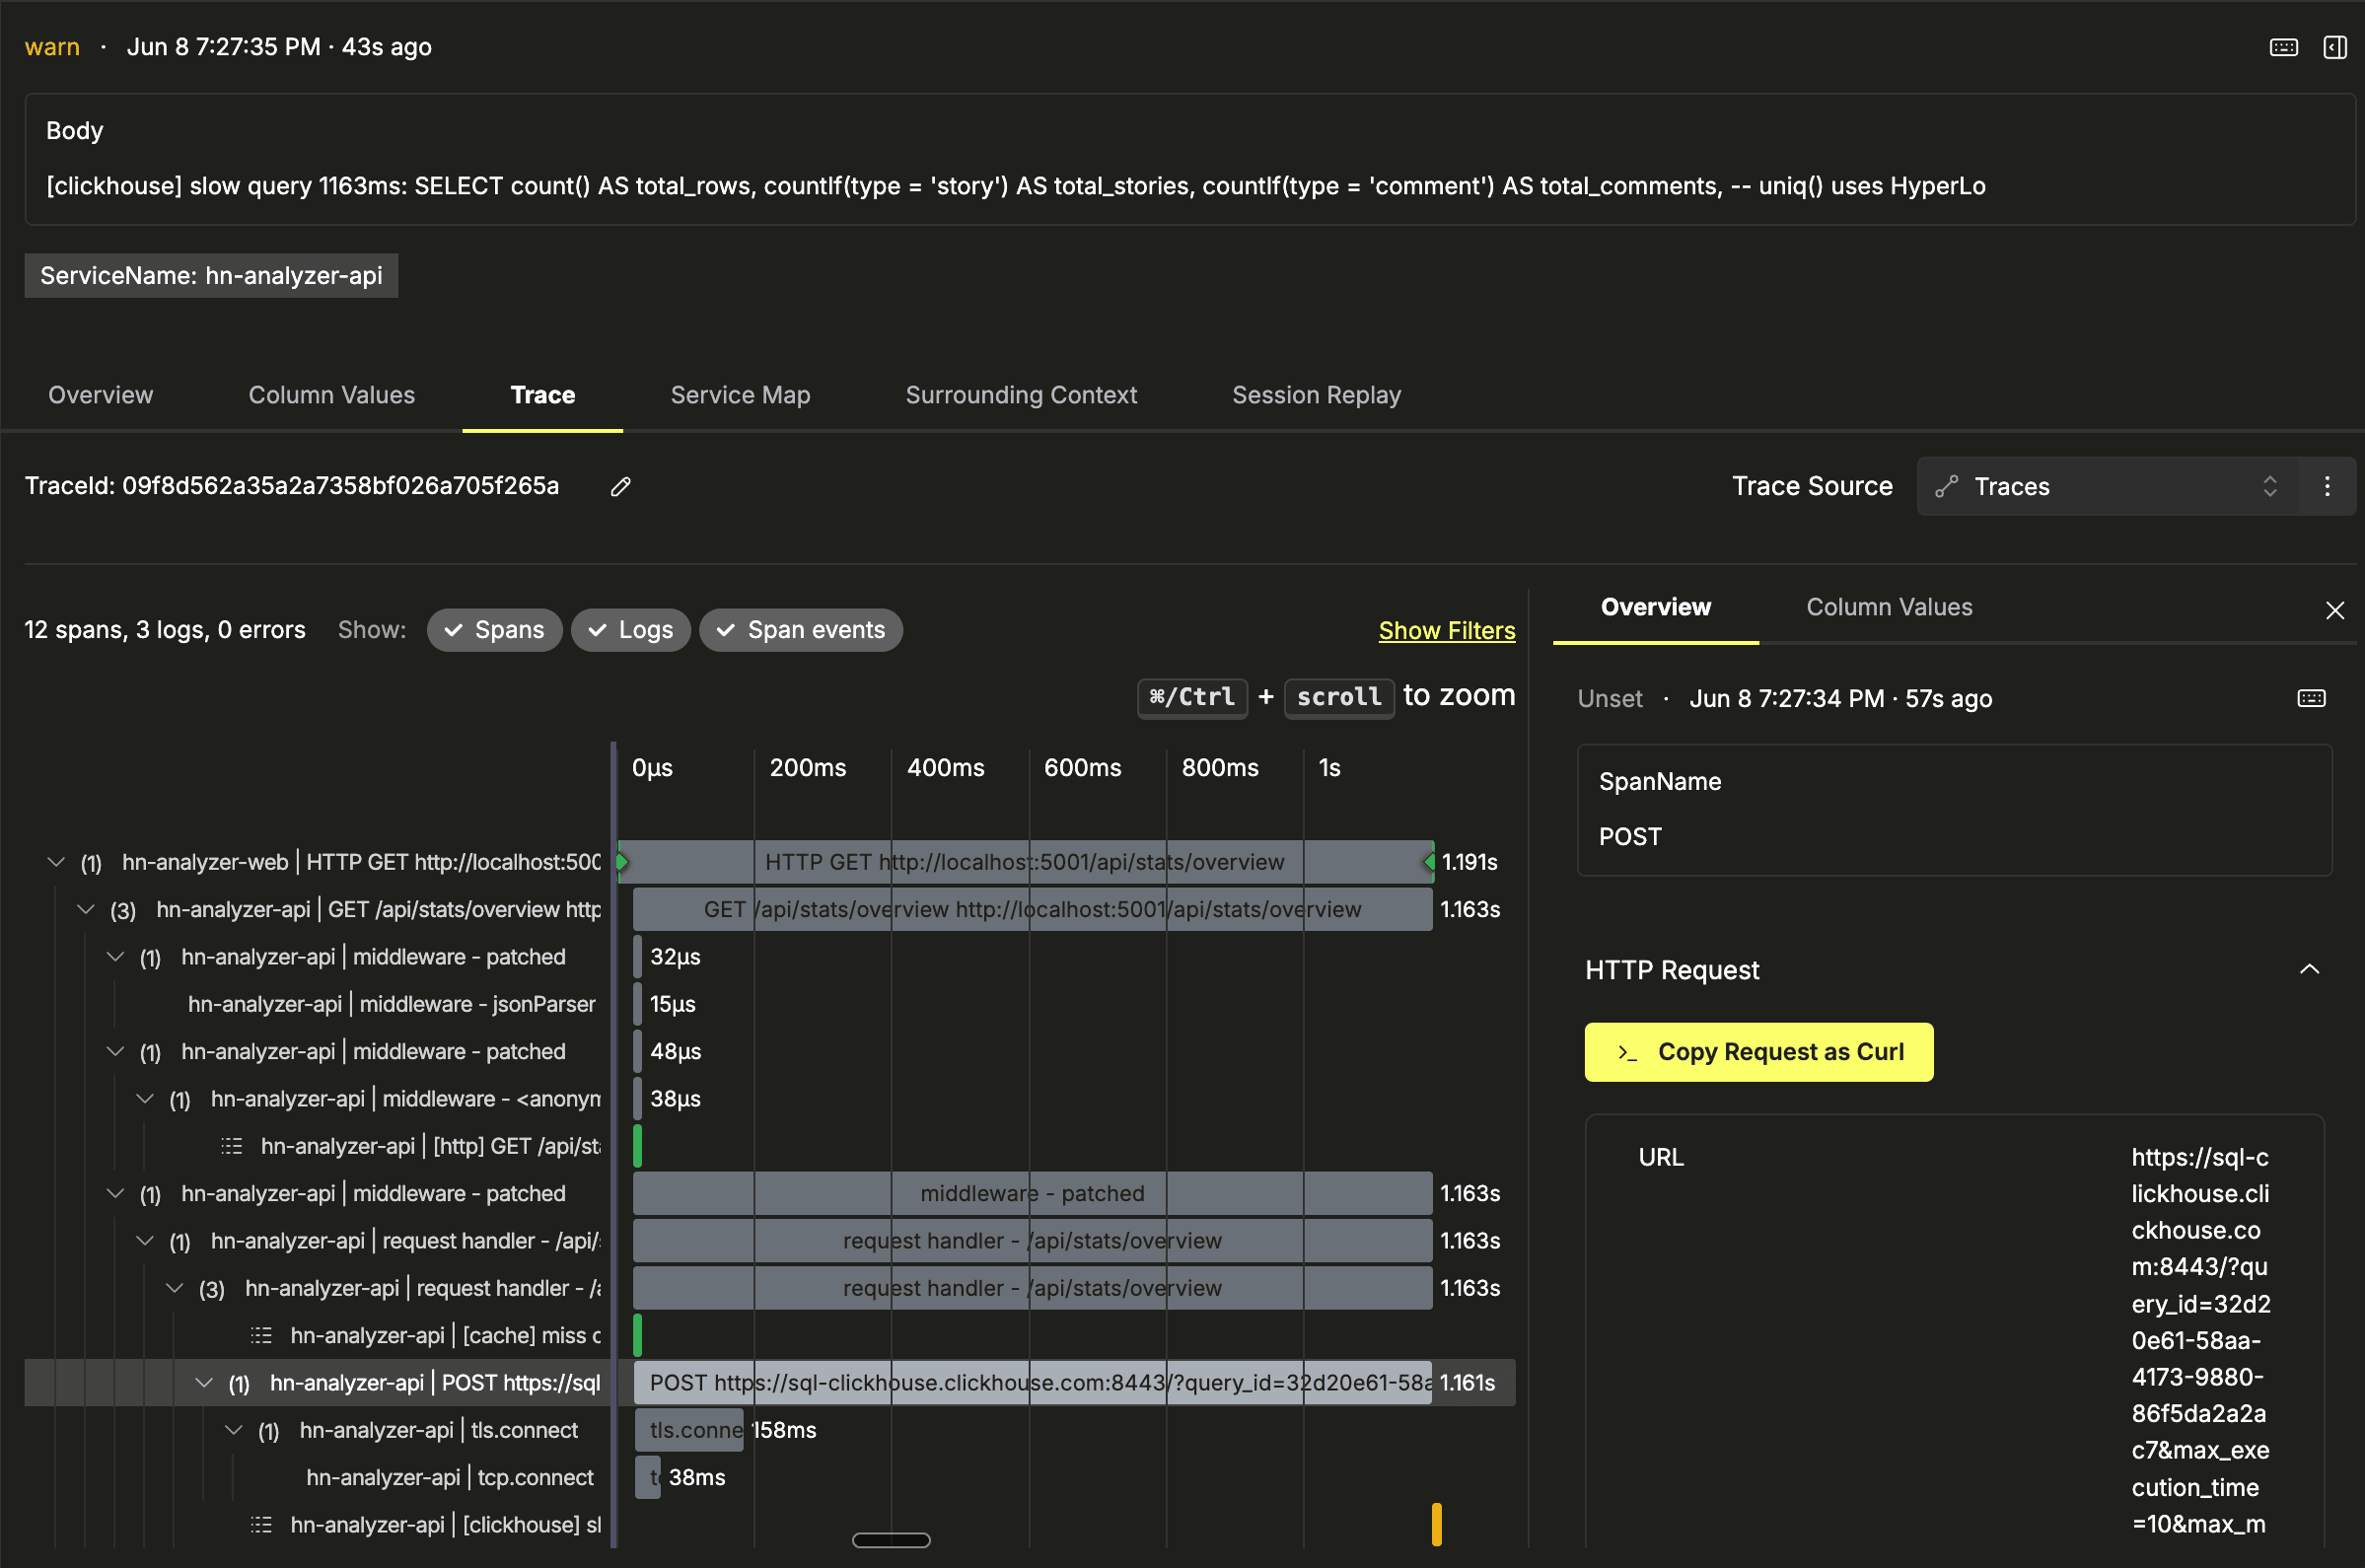
- Click into a request and walk up the trace. You will see the Express handler span, a child HTTP span pointing at
sql-clickhouse.clickhouse.comwith real network duration, and correlatedconsole.logrecords on the same trace.
- Open Session Replay to play back a scrubbable video of a browser session, synced to the trace timeline.
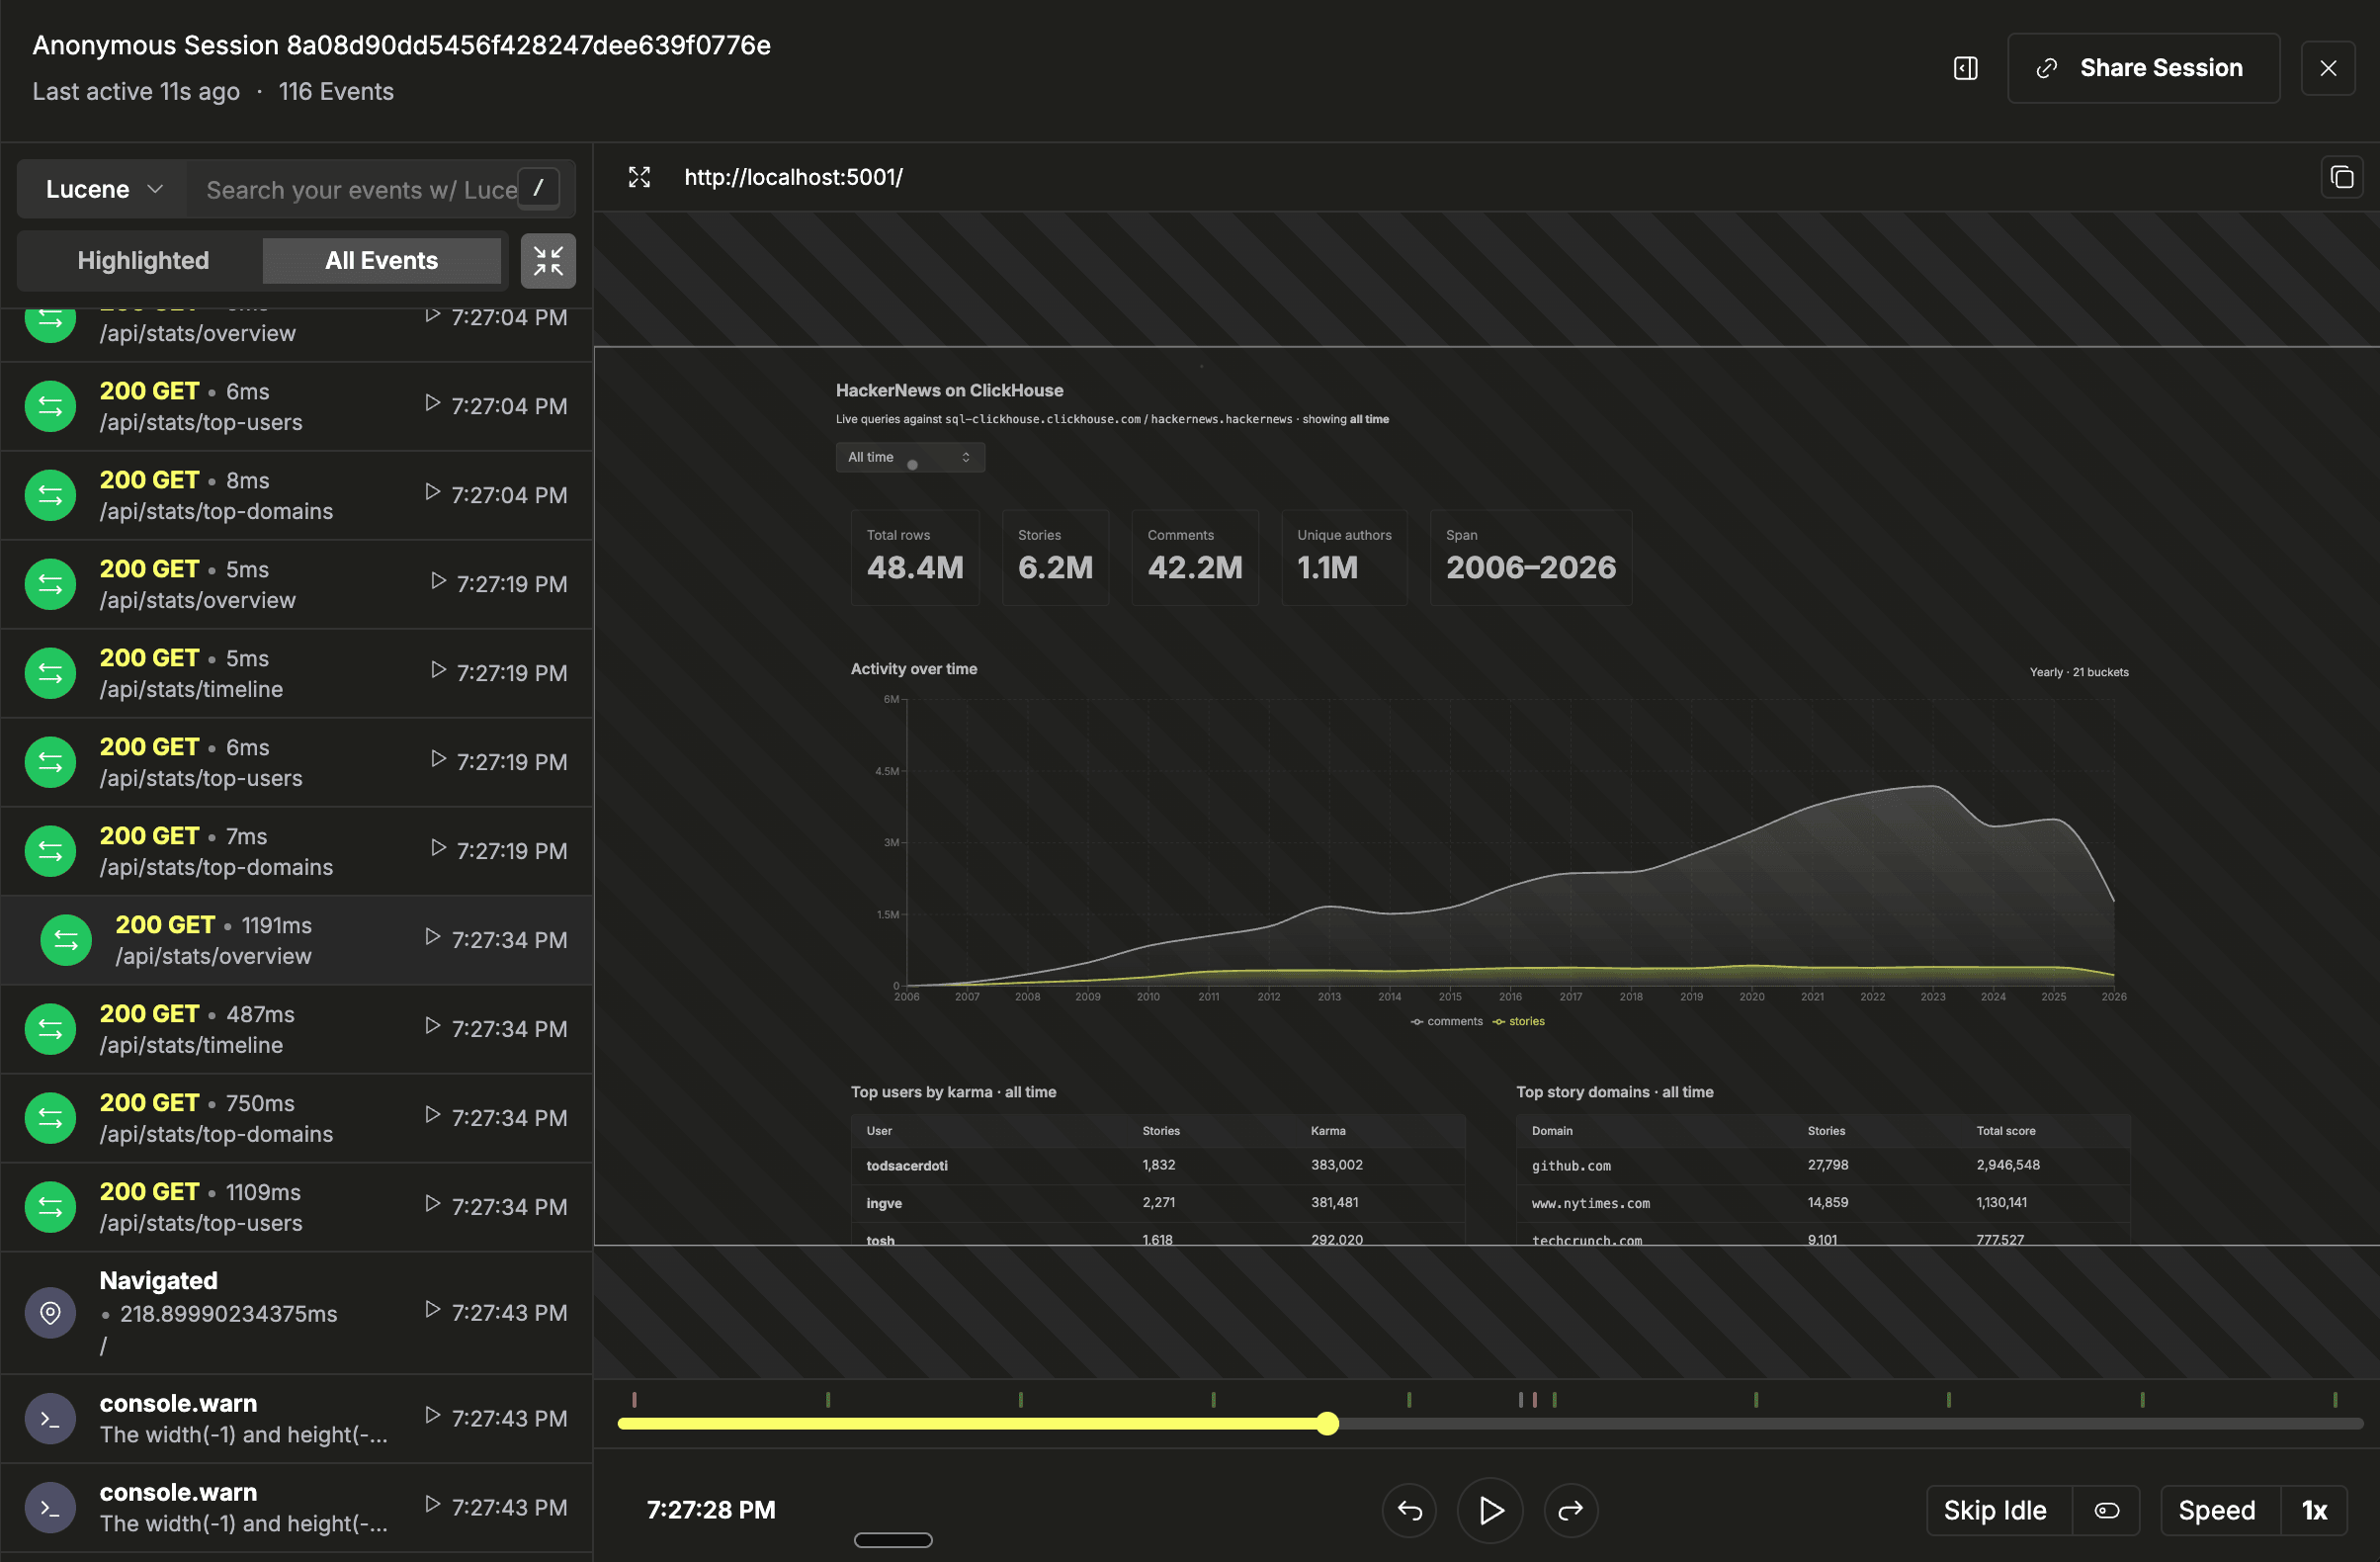
Logs, metrics, traces, and session replays land in the same UI, share the same query language, and are correlated automatically.
Learn more
- HackerNews Analyzer: the demo repository this guide instruments.
- Session Replay: feature overview, SDK options, and privacy controls.
- Session Replay Demo: a self-contained demo with a local ClickStack instance.
- ClickStack Getting Started: deploy ClickStack and ingest your first data.
- All Sample Datasets: other example datasets and guides.