Set up docs MCP
This guide allows you to collect logs and metrics from your Kubernetes system, sending them to ClickStack for visualization and analysis. For demo data we use optionally use the ClickStack fork of the official OpenTelemetry demo.
Prerequisites
This guide requires you to have:
- A Kubernetes cluster (v1.20+ recommended) with at least 32 GiB of RAM and 100GB of disk space available on one node for ClickHouse.
- Helm v3+
kubectl, configured to interact with your cluster
Deployment options
You can follow this guide using either of the following deployment options:
-
Open Source ClickStack: Deploy ClickStack entirely within your Kubernetes cluster, including:
- ClickHouse
- HyperDX
- MongoDB (used for dashboard state and configuration)
-
Managed ClickStack, with ClickHouse and the ClickStack UI (HyperDX) managed in ClickHouse Cloud. This eliminates the need to run ClickHouse or HyperDX inside your cluster.
To simulate application traffic, you can optionally deploy the ClickStack fork of the OpenTelemetry Demo Application. This generates telemetry data including logs, metrics, and traces. If you already have workloads running in your cluster, you can skip this step and monitor existing pods, nodes, and containers.
Install cert-manager (Optional)
If your setup needs TLS certificates, install cert-manager using Helm:
# Add Cert manager repo

helm repo add jetstack https://charts.jetstack.io

helm install cert-manager jetstack/cert-manager --namespace cert-manager --create-namespace --set startupapicheck.timeout=5m --set installCRDs=true --set global.leaderElection.namespace=cert-manager
Deploy the OpenTelemetry Demo (Optional)
This step is optional and intended if you have no existing pods to monitor. Although users with existing services deployed in their Kubernetes environment can skip, this demo does include instrumented microservices which generate trace and session replay data - allowing users to explore all features of ClickStack.
The following deploys the ClickStack fork of the OpenTelemetry Demo application stack within a Kubernetes cluster, tailored for observability testing and showcasing instrumentation. It includes backend microservices, load generators, telemetry pipelines, supporting infrastructure (e.g., Kafka, Redis), and SDK integrations with ClickStack.
All services are deployed to the otel-demo namespace. Each deployment includes:
- Automatic instrumentation with OTel and ClickStack SDKS for traces, metrics, and logs.
- All services send their instrumentation to a
my-hyperdx-hdx-oss-v2-otel-collectorOpenTelemetry collector (not deployed) - Forwarding of resource tags to correlate logs, metrics and traces via the environment variable
OTEL_RESOURCE_ATTRIBUTES.
## download demo Kubernetes manifest file
curl -O https://raw.githubusercontent.com/ClickHouse/opentelemetry-demo/refs/heads/main/kubernetes/opentelemetry-demo.yaml
# wget alternative
# wget https://raw.githubusercontent.com/ClickHouse/opentelemetry-demo/refs/heads/main/kubernetes/opentelemetry-demo.yaml
kubectl apply --namespace otel-demo -f opentelemetry-demo.yaml
On deployment of the demo, confirm all pods have been successfully created and are in the Running state:
kubectl get pods -n=otel-demo

NAME                                 READY   STATUS    RESTARTS   AGE
accounting-fd44f4996-fcl4k           1/1     Running   0          13m
ad-769f968468-qq8mw                  1/1     Running   0          13m
artillery-loadgen-7bc4bdf47d-5sb96   1/1     Running   0          13m
cart-5b4c98bd8-xm7m2                 1/1     Running   0          13m
checkout-784f69b785-cnlpp            1/1     Running   0          13m
currency-fd7775b9c-rf6cr             1/1     Running   0          13m
email-5c54598f99-2td8s               1/1     Running   0          13m
flagd-5466775df7-zjb4x               2/2     Running   0          13m
fraud-detection-5769fdf75f-cjvgh     1/1     Running   0          13m
frontend-6dcb696646-fmcdz            1/1     Running   0          13m
frontend-proxy-7b8f6cd957-s25qj      1/1     Running   0          13m
image-provider-5fdb455756-fs4xv      1/1     Running   0          13m
kafka-7b6666866d-xfzn6               1/1     Running   0          13m
load-generator-57cbb7dfc9-ncxcf      1/1     Running   0          13m
payment-6d96f9bcbd-j8tj6             1/1     Running   0          13m
product-catalog-7fb77f9c78-49bhj     1/1     Running   0          13m
quote-576c557cdf-qn6pr               1/1     Running   0          13m
recommendation-546cc68fdf-8x5mm      1/1     Running   0          13m
shipping-7fc69f7fd7-zxrx6            1/1     Running   0          13m
valkey-cart-5f7b667bb7-gl5v4         1/1     Running   0          13m
Demo Architecture
The demo is composed of microservices written in different programming languages that talk to each other over gRPC and HTTP and a load generator that uses Locust to fake user traffic. The original source code for this demo has been modified to use ClickStack instrumentation.
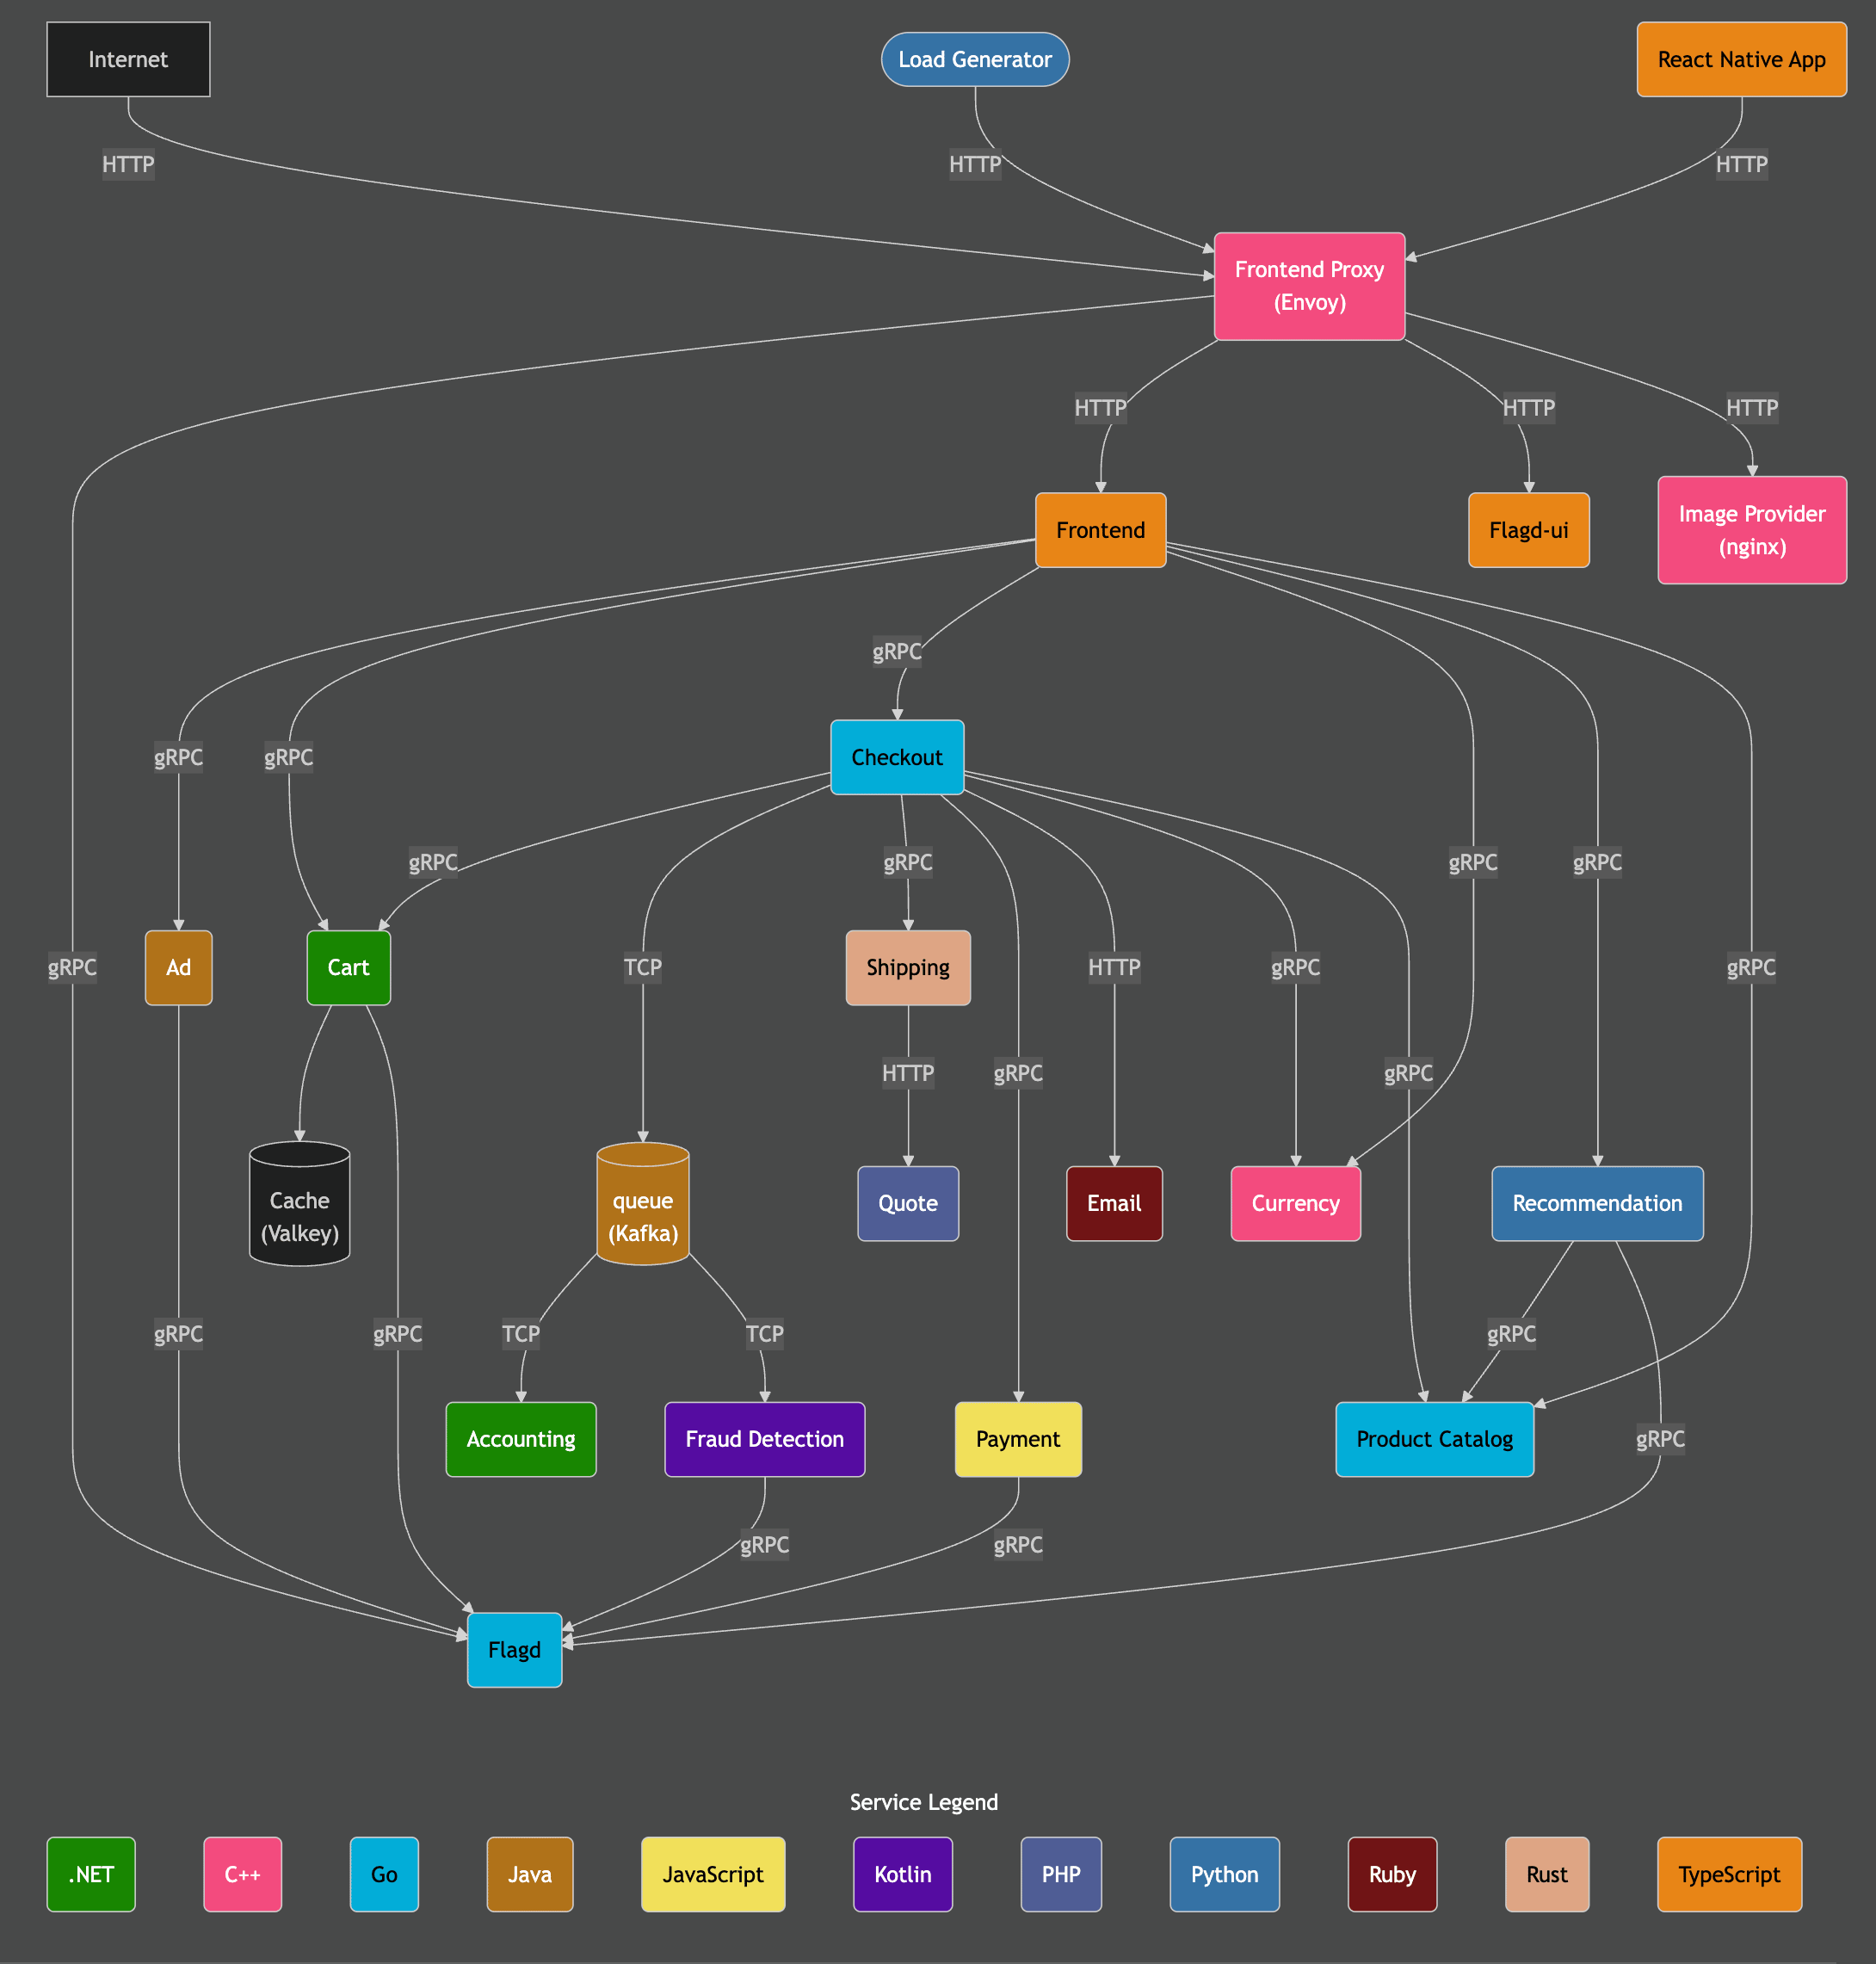
Credit: https://opentelemetry.io/docs/demo/architecture/
Further details on the demo can be found in:
Add the ClickStack Helm chart repository
To deploy ClickStack, we use the official Helm chart.
This requires us to add the HyperDX Helm repository:
helm repo add hyperdx https://hyperdxio.github.io/helm-charts
helm repo update
Deploy ClickStack
With the Helm chart installed, you can deploy ClickStack to your cluster. You can either run all components, including ClickHouse and HyperDX, within your Kubernetes environment, or just deploy the collector and rely on Managed ClickStack for ClickHouse and the UI HyperDX.
ClickStack Open Source (self-managed)
The following command installs ClickStack to the otel-demo namespace. The helm chart deploys:
- A ClickHouse instance
- HyperDX
- The ClickStack distribution of the OTel collector
- MongoDB for storage of HyperDX application state
Users not deploying the OTel demo can modify this, selecting an appropriate namespace.
helm install my-hyperdx hyperdx/hdx-oss-v2 --set clickhouse.persistence.dataSize=100Gi --set global.storageClassName="standard-rwo" -n otel-demoManaged ClickStack
If you’d rather use Managed ClickStack, you can deploy ClickStack and disable the included ClickHouse.
# specify ClickHouse Cloud credentials
export CLICKHOUSE_URL=<CLICKHOUSE_CLOUD_URL> # full https url
export CLICKHOUSE_USER=<CLICKHOUSE_USER>
export CLICKHOUSE_PASSWORD=<CLICKHOUSE_PASSWORD>

helm install my-hyperdx hyperdx/hdx-oss-v2  --set clickhouse.enabled=false --set clickhouse.persistence.enabled=false --set otel.clickhouseEndpoint=${CLICKHOUSE_URL} --set clickhouse.config.users.otelUserName=${CLICKHOUSE_USER} --set clickhouse.config.users.otelUserPassword=${CLICKHOUSE_PASSWORD} --set global.storageClassName="standard-rwo" -n otel-demo
To verify the deployment status, run the following command and confirm all components are in the Running state. Note that ClickHouse will be absent if you’re using Managed ClickStack:
kubectl get pods -l "app.kubernetes.io/name=hdx-oss-v2" -n otel-demo

NAME                                                    READY   STATUS    RESTARTS   AGE
my-hyperdx-hdx-oss-v2-app-78876d79bb-565tb              1/1     Running   0          14m
my-hyperdx-hdx-oss-v2-clickhouse-57975fcd6-ggnz2        1/1     Running   0          14m
my-hyperdx-hdx-oss-v2-mongodb-984845f96-czb6m           1/1     Running   0          14m
my-hyperdx-hdx-oss-v2-otel-collector-64cf698f5c-8s7qj   1/1     Running   0          14m
Access the HyperDX UI
For security, the service uses ClusterIP and isn’t exposed externally by default.
To access the HyperDX UI, port forward from 3000 to the local port 8080.
kubectl port-forward \
 pod/$(kubectl get pod -l app.kubernetes.io/name=hdx-oss-v2 -o jsonpath='{.items[0].metadata.name}' -n otel-demo) \
  8080:3000 \
 -n otel-demo
Navigate http://localhost:8080 to access the HyperDX UI.
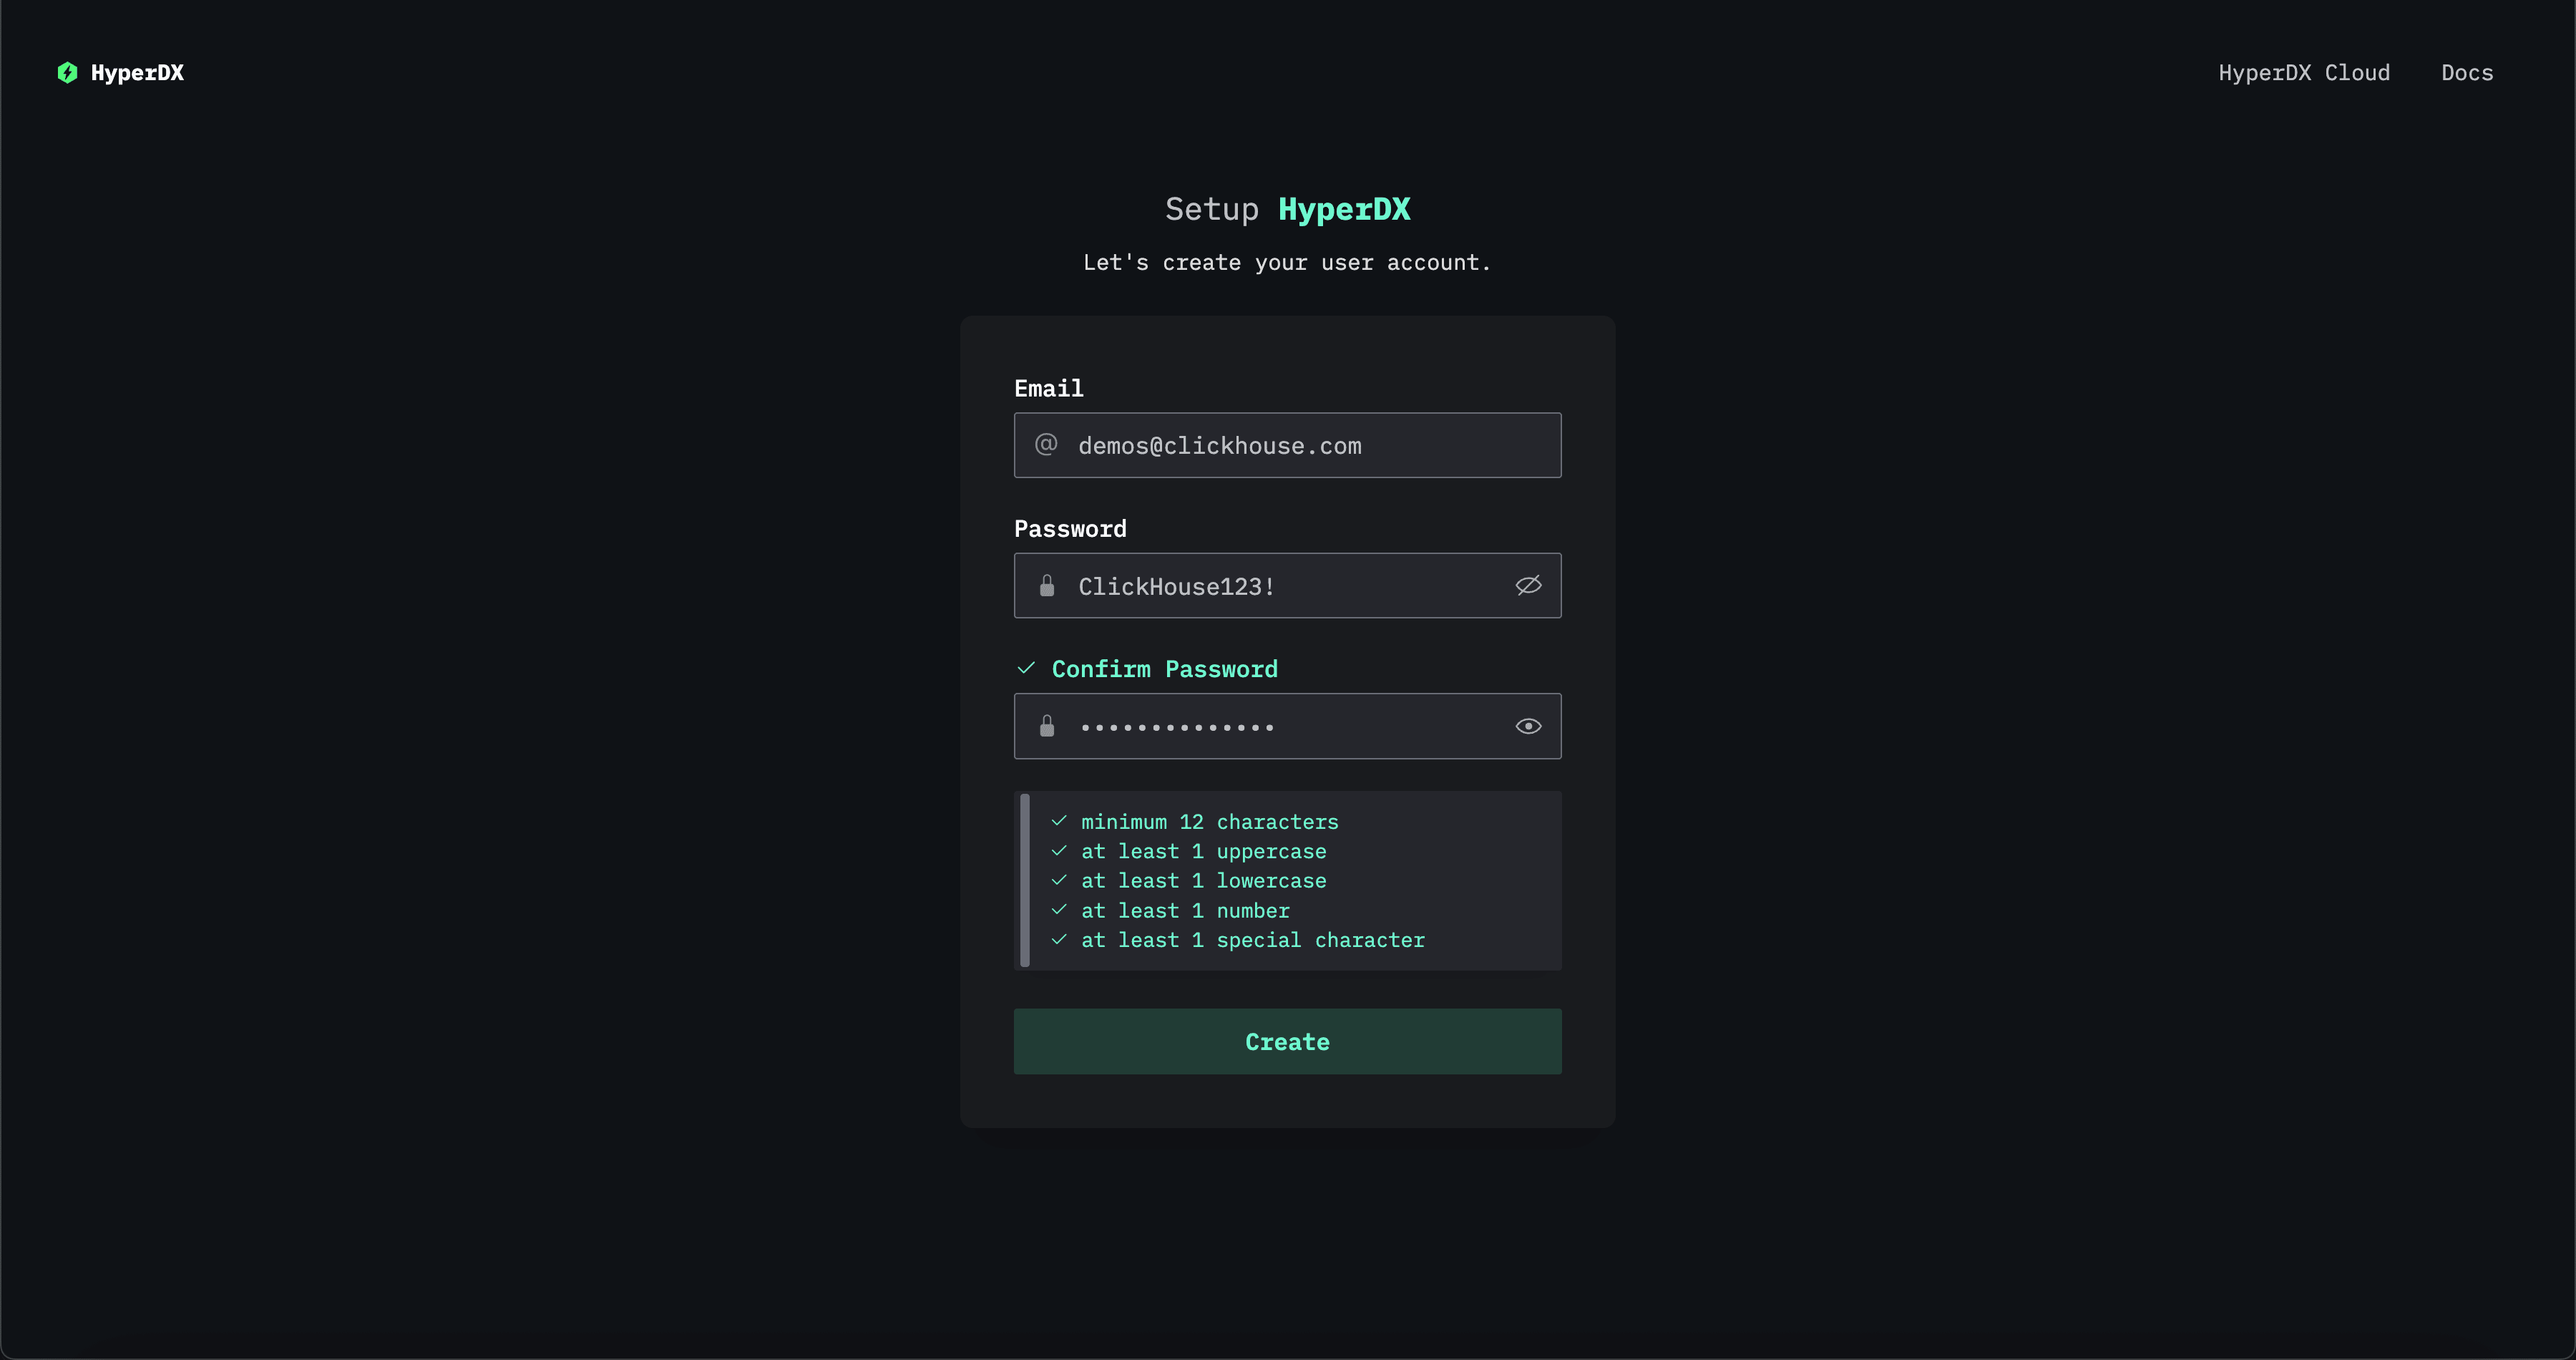
Create a user, providing a username and password that meets the complexity requirements.
Retrieve ingestion API key
Ingestion to the OTel collector deployed by the ClickStack collector is secured with an ingestion key.
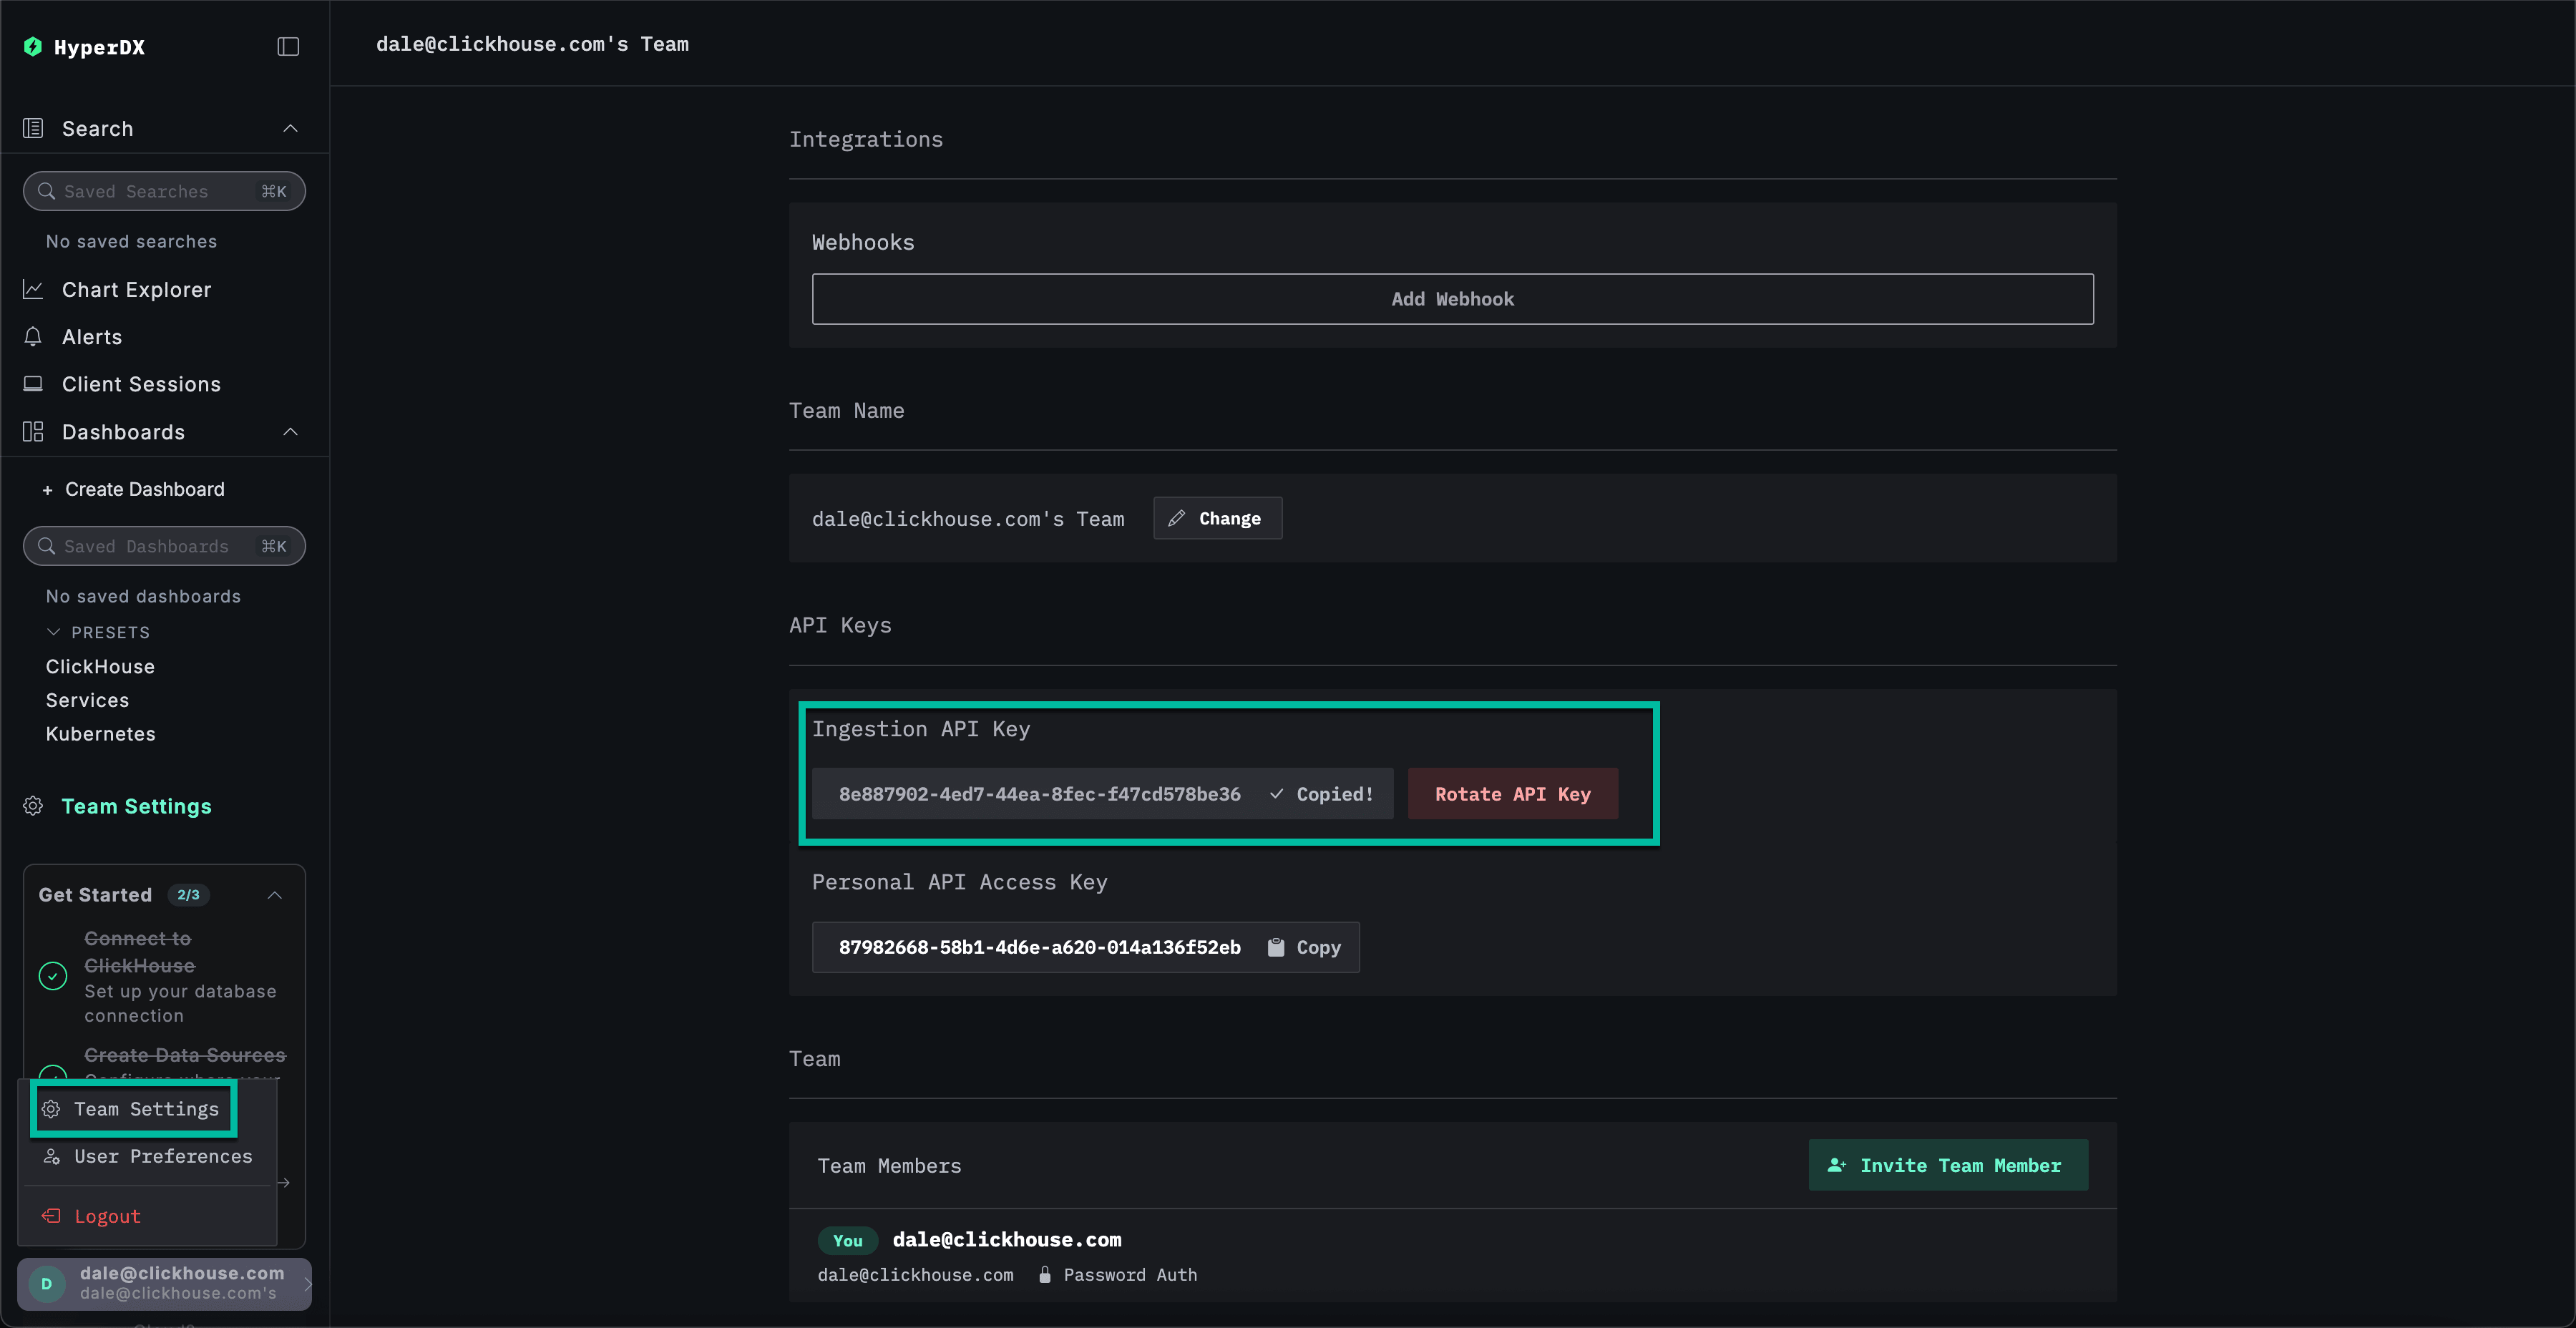
Navigate to Team Settings and copy the Ingestion API Key from the API Keys section. This API key ensures data ingestion through the OpenTelemetry collector is secure.
Create API Key Kubernetes Secret
Create a new Kubernetes secret with the Ingestion API Key and a config map containing the location of the OTel collector deployed with the ClickStack helm chart. Later components will use this to allow ingest into the collector deployed with the ClickStack Helm chart:
# create secret with the ingestion API key
kubectl create secret generic hyperdx-secret \
--from-literal=HYPERDX_API_KEY=<ingestion_api_key> \
-n otel-demo

# create a ConfigMap pointing to the ClickStack OTel collector deployed above
kubectl create configmap -n=otel-demo otel-config-vars --from-literal=YOUR_OTEL_COLLECTOR_ENDPOINT=http://my-hyperdx-hdx-oss-v2-otel-collector:4318
Restart the OpenTelemetry demo application pods to take into account the Ingestion API Key.
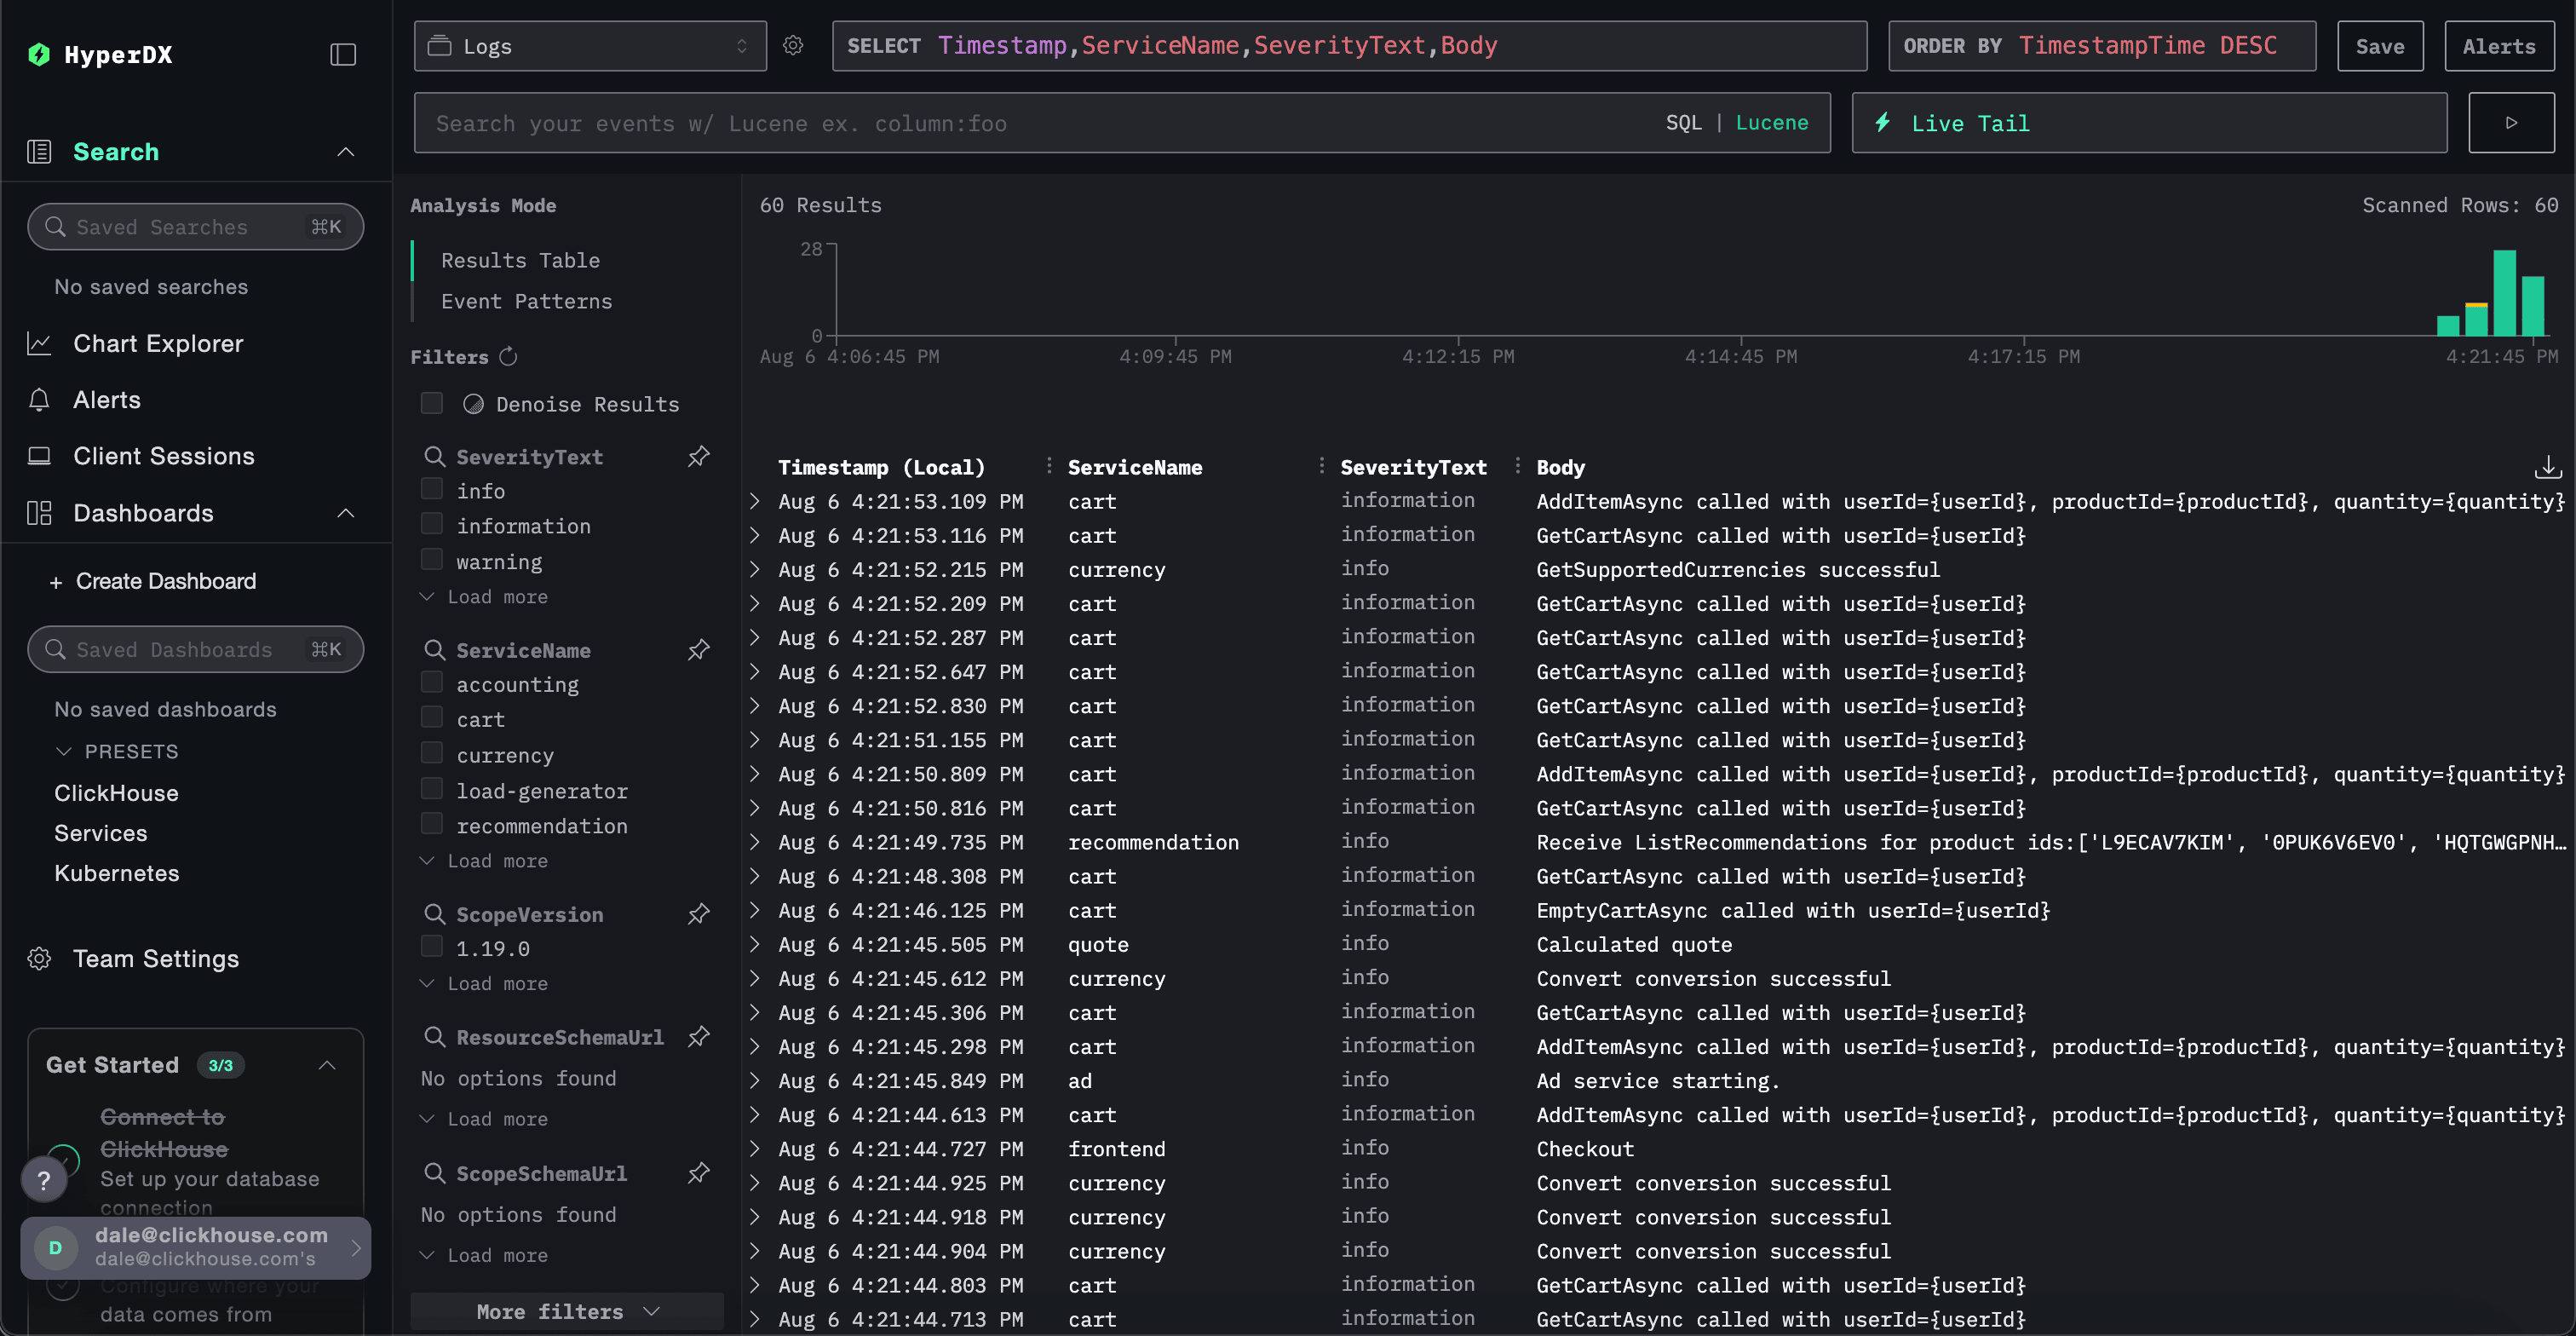
kubectl rollout restart deployment -n otel-demo -l app.kubernetes.io/part-of=opentelemetry-demoTrace and log data from demo services should now begin to flow into HyperDX.
Add the OpenTelemetry Helm repo
To collect Kubernetes metrics, we will deploy a standard OTel collector, configuring this to send data securely to our ClickStack collector using the above ingestion API key.
This requires us to install the OpenTelemetry Helm repo:
# Add Otel Helm repo
helm repo add open-telemetry https://open-telemetry.github.io/opentelemetry-helm-charts
Deploy Kubernetes collector components
To collect logs and metrics from both the cluster itself and each node, we’ll need to deploy two separate OpenTelemetry collectors, each with its own manifest. The two manifests provided - k8s_deployment.yaml and k8s_daemonset.yaml - work together to collect comprehensive telemetry data from your Kubernetes cluster.
-
k8s_deployment.yamldeploys a single OpenTelemetry Collector instance responsible for collecting cluster-wide events and metadata. It gathers Kubernetes events, cluster metrics, and enriches telemetry data with pod labels and annotations. This collector runs as a standalone deployment with a single replica to avoid duplicate data. -
k8s_daemonset.yamldeploys a DaemonSet-based collector that runs on every node in your cluster. It collects node-level and pod-level metrics, as well as container logs, using components likekubeletstats,hostmetrics, and Kubernetes attribute processors. These collectors enrich logs with metadata and send them to HyperDX using the OTLP exporter.
Together, these manifests enable full-stack observability across the cluster, from infrastructure to application-level telemetry, and send the enriched data to ClickStack for centralized analysis.
First, install the collector as a deployment:
# download manifest file
curl -O https://raw.githubusercontent.com/ClickHouse/clickhouse-docs/refs/heads/main/docs/use-cases/observability/clickstack/example-datasets/_snippets/k8s_deployment.yaml
# install the helm chart
helm install --namespace otel-demo k8s-otel-deployment open-telemetry/opentelemetry-collector -f k8s_deployment.yaml
k8s_deployment.yaml
# k8s_deployment.yaml
mode: deployment

image:
  repository: otel/opentelemetry-collector-contrib
  tag: 0.123.0

# We only want one of these collectors - any more and we'd produce duplicate data
replicaCount: 1

presets:
  kubernetesAttributes:
    enabled: true
    # When enabled, the processor will extract all labels for an associated pod and add them as resource attributes.
    # The label's exact name will be the key.
    extractAllPodLabels: true
    # When enabled, the processor will extract all annotations for an associated pod and add them as resource attributes.
    # The annotation's exact name will be the key.
    extractAllPodAnnotations: true
  # Configures the collector to collect Kubernetes events.
  # Adds the k8sobject receiver to the logs pipeline and collects Kubernetes events by default.
  # More Info: https://opentelemetry.io/docs/kubernetes/collector/components/#kubernetes-objects-receiver
  kubernetesEvents:
    enabled: true
  # Configures the Kubernetes Cluster Receiver to collect cluster-level metrics.
  # Adds the k8s_cluster receiver to the metrics pipeline and adds the necessary rules to ClusteRole.
  # More Info: https://opentelemetry.io/docs/kubernetes/collector/components/#kubernetes-cluster-receiver
  clusterMetrics:
    enabled: true

extraEnvs:
  - name: HYPERDX_API_KEY
    valueFrom:
      secretKeyRef:
        name: hyperdx-secret
        key: HYPERDX_API_KEY
        optional: true
  - name: YOUR_OTEL_COLLECTOR_ENDPOINT
    valueFrom:
      configMapKeyRef:
        name: otel-config-vars
        key: YOUR_OTEL_COLLECTOR_ENDPOINT

config:
  exporters:
    otlphttp:
      endpoint: "${env:YOUR_OTEL_COLLECTOR_ENDPOINT}"
      compression: gzip
      headers:
        authorization: "${env:HYPERDX_API_KEY}"
  service:
    pipelines:
      logs:
        exporters:
          - otlphttp
      metrics:
        exporters:
          - otlphttp
Next, deploy the collector as a DaemonSet for node and pod-level metrics and logs:
# download manifest file
curl -O https://raw.githubusercontent.com/ClickHouse/clickhouse-docs/refs/heads/main/docs/use-cases/observability/clickstack/example-datasets/_snippets/k8s_daemonset.yaml
# install the helm chart
helm install --namespace otel-demo k8s-otel-daemonset open-telemetry/opentelemetry-collector -f k8s_daemonset.yaml
k8s_daemonset.yaml
# k8s_daemonset.yaml
mode: daemonset

image:
  repository: otel/opentelemetry-collector-contrib
  tag: 0.123.0

# Required to use the kubeletstats cpu/memory utilization metrics
clusterRole:
  create: true
  rules:
    - apiGroups:
        - ''
      resources:
        - nodes/proxy
      verbs:
        - get

presets:
  logsCollection:
    enabled: true
  hostMetrics:
    enabled: true
  # Configures the Kubernetes Processor to add Kubernetes metadata.
  # Adds the k8sattributes processor to all the pipelines and adds the necessary rules to ClusterRole.
  # More Info: https://opentelemetry.io/docs/kubernetes/collector/components/#kubernetes-attributes-processor
  kubernetesAttributes:
    enabled: true
    # When enabled, the processor will extract all labels for an associated pod and add them as resource attributes.
    # The label's exact name will be the key.
    extractAllPodLabels: true
    # When enabled, the processor will extract all annotations for an associated pod and add them as resource attributes.
    # The annotation's exact name will be the key.
    extractAllPodAnnotations: true
  # Configures the collector to collect node, pod, and container metrics from the API server on a kubelet..
  # Adds the kubeletstats receiver to the metrics pipeline and adds the necessary rules to ClusterRole.
  # More Info: https://opentelemetry.io/docs/kubernetes/collector/components/#kubeletstats-receiver
  kubeletMetrics:
    enabled: true

extraEnvs:
  - name: HYPERDX_API_KEY
    valueFrom:
      secretKeyRef:
        name: hyperdx-secret
        key: HYPERDX_API_KEY
        optional: true
  - name: YOUR_OTEL_COLLECTOR_ENDPOINT
    valueFrom:
      configMapKeyRef:
        name: otel-config-vars
        key: YOUR_OTEL_COLLECTOR_ENDPOINT

config:
  receivers:
    # Configures additional kubelet metrics
    kubeletstats:
      collection_interval: 20s
      auth_type: 'serviceAccount'
      endpoint: '${env:K8S_NODE_NAME}:10250'
      insecure_skip_verify: true
      metrics:
        k8s.pod.cpu_limit_utilization:
          enabled: true
        k8s.pod.cpu_request_utilization:
          enabled: true
        k8s.pod.memory_limit_utilization:
          enabled: true
        k8s.pod.memory_request_utilization:
          enabled: true
        k8s.pod.uptime:
          enabled: true
        k8s.node.uptime:
          enabled: true
        k8s.container.cpu_limit_utilization:
          enabled: true
        k8s.container.cpu_request_utilization:
          enabled: true
        k8s.container.memory_limit_utilization:
          enabled: true
        k8s.container.memory_request_utilization:
          enabled: true
        container.uptime:
          enabled: true

  exporters:
    otlphttp:
      endpoint: "${env:YOUR_OTEL_COLLECTOR_ENDPOINT}"
      compression: gzip
      headers:
        authorization: "${env:HYPERDX_API_KEY}"

  service:
    pipelines:
      logs:
        exporters:
          - otlphttp
      metrics:
        exporters:
          - otlphttp
Explore Kubernetes data in HyperDX
Navigate to your HyperDX UI - either using your Kubernetes-deployed instance or via Managed ClickStack.
Managed ClickStack
If using Managed ClickStack, simply log in to your ClickHouse Cloud service and select “ClickStack” from the left menu. You will be automatically authenticated and won’t need to create a user.
Data sources for logs, metrics and traces will be pre-created for you.
ClickStack Open Source
To access the local deployed HyperDX, you can port forward using the local command and access HyperDX at http://localhost:8080.
kubectl port-forward \
 pod/$(kubectl get pod -l app.kubernetes.io/name=hdx-oss-v2 -o jsonpath='{.items[0].metadata.name}' -n otel-demo) \
  8080:3000 \
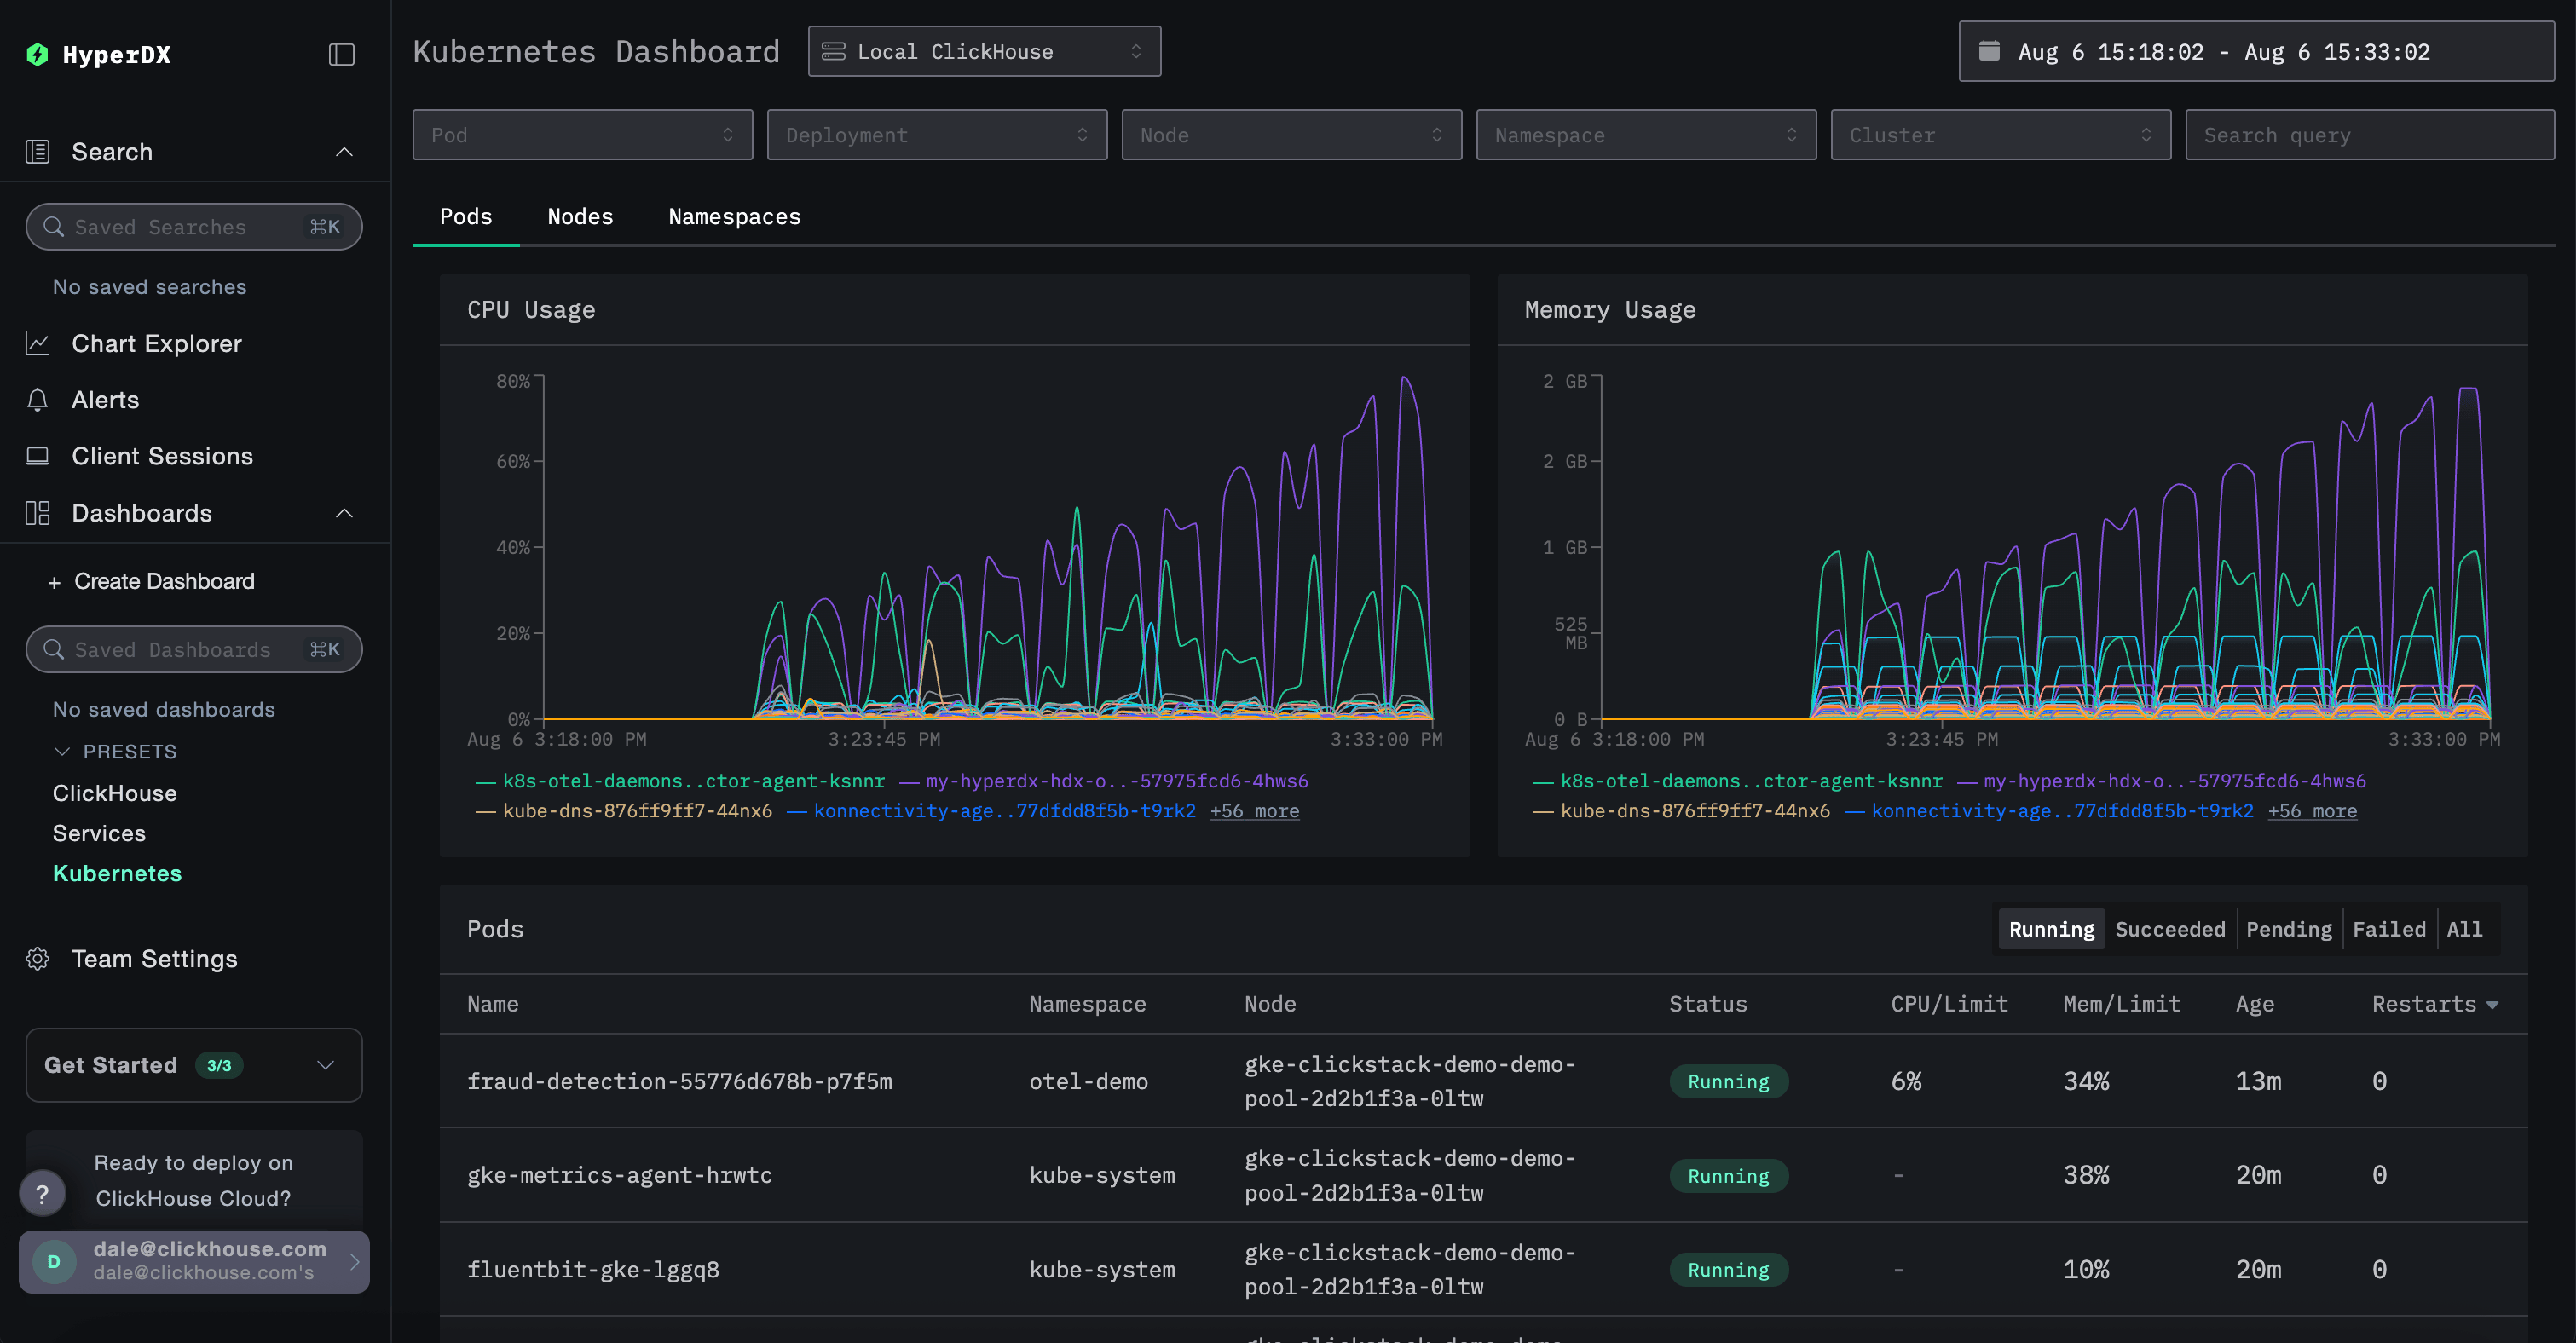
-n otel-demoTo explore the Kubernetes data, navigate to the dedicated present dashboard at /kubernetes e.g. http://localhost:8080/kubernetes.
Each of the tabs, Pods, Nodes, and Namespaces, should be populated with data.