

 Set up docs MCP
Overview
AWS CloudWatch is a monitoring service for AWS resources and applications. While CloudWatch provides log aggregation, forwarding logs to ClickStack allows you to:
- Analyze logs alongside metrics and traces in a unified platform
- Query logs using ClickHouse’s SQL interface
- Reduce costs by archiving or reducing CloudWatch retention
This guide shows you how to forward CloudWatch logs to ClickStack using the OpenTelemetry Collector.
Integration with existing CloudWatch log groups
This section covers configuring the OpenTelemetry Collector to pull logs from your existing CloudWatch log groups and forward them to ClickStack.
If you would like to test the integration before configuring your production setup, you can test with our demo dataset in the demo dataset section.
Prerequisites
- ClickStack instance running
- AWS account with CloudWatch log groups
- AWS credentials with appropriate IAM permissions
Get ClickStack API key
The OpenTelemetry Collector sends data to ClickStack’s OTLP endpoint, which requires authentication.
- Open HyperDX at your ClickStack URL (e.g., http://localhost:8080)
- Create an account or log in if needed
- Navigate to Team Settings → API Keys
- Copy your Ingestion API Key
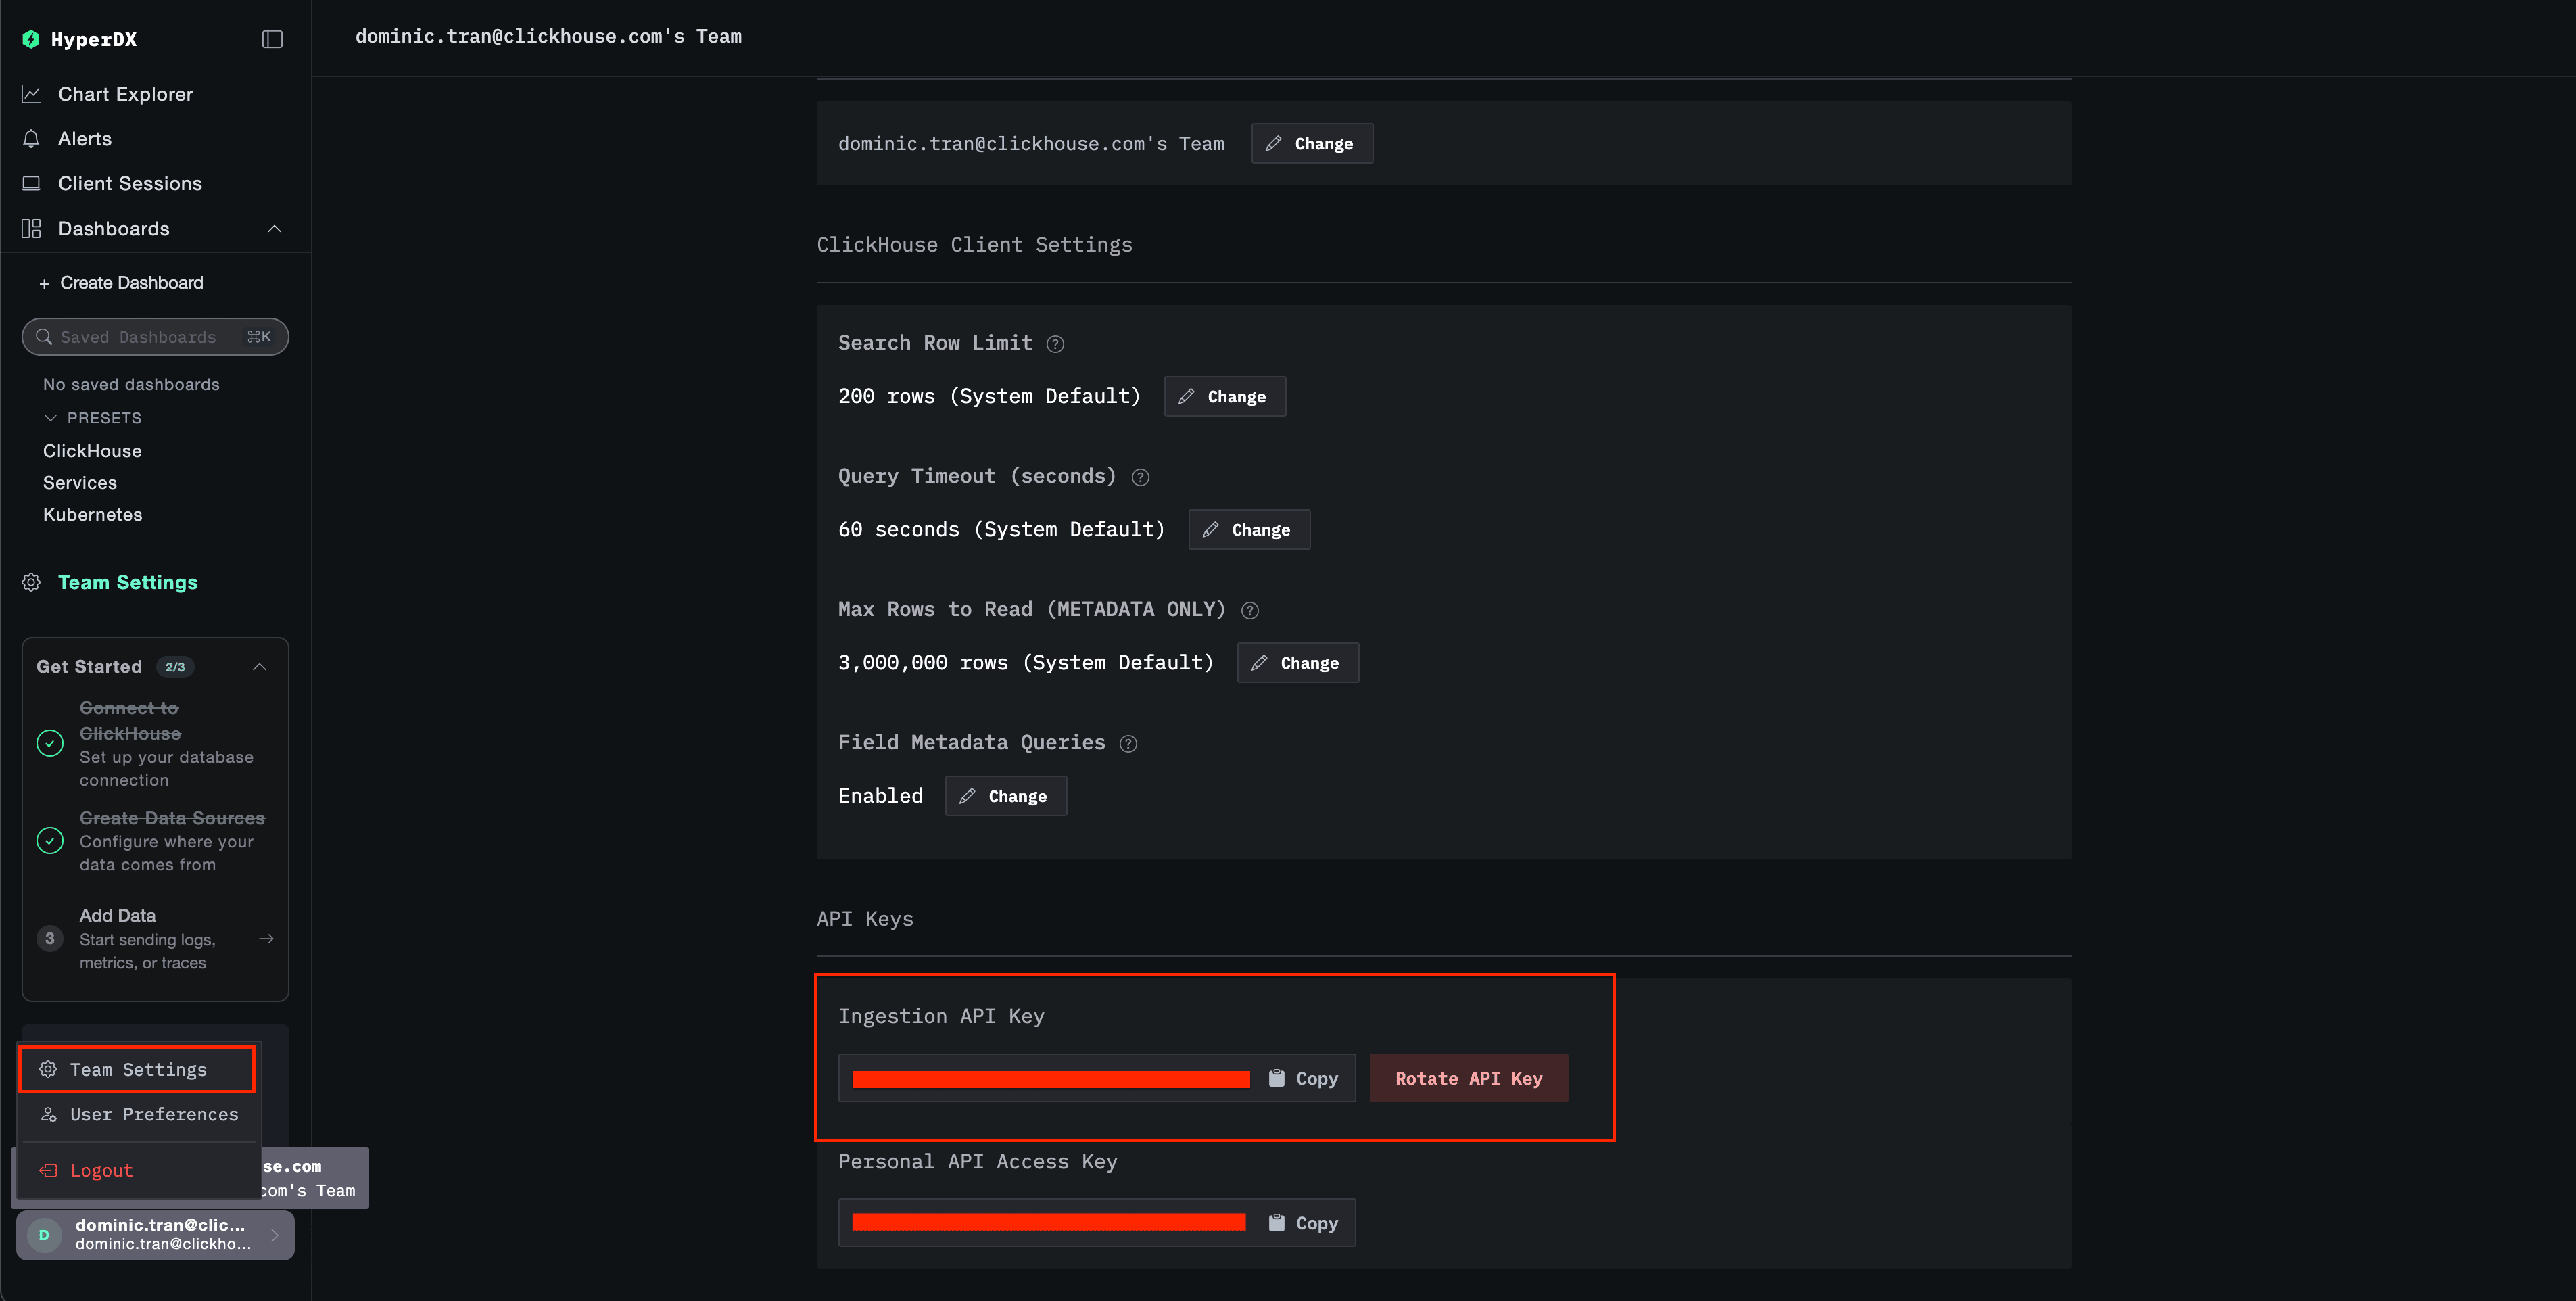
Save this as an environment variable:
export CLICKSTACK_API_KEY="your-api-key-here"Configure AWS credentials
Export your AWS credentials as environment variables. The method depends on your authentication type:
For AWS SSO users (recommended for most organizations):
# Login to SSO
aws sso login --profile YOUR_PROFILE_NAME

# Export credentials to environment variables
eval $(aws configure export-credentials --profile YOUR_PROFILE_NAME --format env)

# Verify credentials work
aws sts get-caller-identity
Replace YOUR_PROFILE_NAME with your AWS SSO profile name (e.g., AccountAdministrators-123456789).
For IAM users with long-term credentials:
export AWS_ACCESS_KEY_ID="your-access-key-id"
export AWS_SECRET_ACCESS_KEY="your-secret-access-key"
export AWS_REGION="us-east-1"

# Verify credentials work
aws sts get-caller-identity
Required IAM permissions:
The AWS account associated with these credentials needs the following IAM policy to read CloudWatch logs:
{
  "Version": "2012-10-17",
  "Statement": [
    {
      "Sid": "CloudWatchLogsRead",
      "Effect": "Allow",
      "Action": [
        "logs:DescribeLogGroups",
        "logs:FilterLogEvents"
      ],
      "Resource": "arn:aws:logs:*:YOUR_ACCOUNT_ID:log-group:*"
    }
  ]
}
Replace YOUR_ACCOUNT_ID with your AWS account ID.
Configure the CloudWatch receiver
Create an otel-collector-config.yaml file with the CloudWatch receiver configuration.
Discover the log groups available in your account
Before editing the config, list the log groups that exist in your region so you can pick real names (and confirm the region is correct):
aws logs describe-log-groups --region us-east-1 \
  --query 'logGroups[].logGroupName' --output table
Example output:
-------------------------------
|      DescribeLogGroups      |
+-----------------------------+
|  /aws-glue/jobs/error       |
|  /aws-glue/jobs/logs-v2     |
|  /aws-glue/jobs/output      |
|  /aws-glue/sessions/error   |
|  /aws-glue/sessions/output  |
+-----------------------------+
Use the names from this list directly in the groups.named block of Example 1 below. For the account above, the named-groups section would become:
groups:
  named:
    /aws-glue/jobs/error:
    /aws-glue/jobs/logs-v2:
    /aws-glue/jobs/output:
    /aws-glue/sessions/error:
    /aws-glue/sessions/output:
Alternatively, if the groups you want share a common prefix (here /aws-glue/), use Example 2 with prefix: /aws-glue/ instead of listing them individually.
Example 1: Named log groups (recommended)
This configuration collects logs from specific named log groups:
receivers:
  awscloudwatch:
    region: us-east-1
    logs:
      poll_interval: 1m
      max_events_per_request: 100
      groups:
        named:
          /aws/lambda/my-function:
          /aws/ecs/my-service:
          /aws/eks/my-cluster/cluster:

processors:
  batch:
    timeout: 10s

exporters:
  otlphttp:
    endpoint: http://localhost:4318
    headers:
      authorization: ${CLICKSTACK_API_KEY}

service:
  pipelines:
    logs:
      receivers: [awscloudwatch]
      processors: [batch]
      exporters: [otlphttp]
Example 2: Autodiscover log groups with prefix
This configuration autodiscovers and collects logs from up to 100 log groups starting with the prefix /aws/lambda:
receivers:
  awscloudwatch:
    region: us-east-1
    logs:
      poll_interval: 1m
      max_events_per_request: 100
      groups:
        autodiscover:
          limit: 100
          prefix: /aws/lambda

processors:
  batch:
    timeout: 10s

exporters:
  otlphttp:
    endpoint: http://localhost:4318
    headers:
      authorization: ${CLICKSTACK_API_KEY}

service:
  pipelines:
    logs:
      receivers: [awscloudwatch]
      processors: [batch]
      exporters: [otlphttp]
Configuration parameters:
region: AWS region where your log groups are locatedpoll_interval: How often to check for new logs (e.g.,1m,5m)max_events_per_request: Maximum number of log events to fetch per requestgroups.autodiscover.limit: Maximum number of log groups to discovergroups.autodiscover.prefix: Filter log groups by prefixgroups.named: Explicitly list log group names to collect
For more configuration options, see the CloudWatch receiver documentation.
Replace the following:
${CLICKSTACK_API_KEY}→ Uses the environment variable you set earlierhttp://localhost:4318→ Your ClickStack endpoint (use your ClickStack host if running remotely)us-east-1→ Your AWS region- Log group names/prefixes → Your actual CloudWatch log groups
Start the collector
Create a docker-compose.yaml file:
services:
  otel-collector:
    image: otel/opentelemetry-collector-contrib:latest
    command: ["--config=/etc/otel-config.yaml"]
    volumes:
      - ./otel-collector-config.yaml:/etc/otel-config.yaml
    environment:
      - AWS_ACCESS_KEY_ID
      - AWS_SECRET_ACCESS_KEY
      - AWS_SESSION_TOKEN
      - AWS_REGION
      - CLICKSTACK_API_KEY
    restart: unless-stopped
    extra_hosts:
      - "host.docker.internal:host-gateway"
Then start the collector:
docker compose up -dView collector logs:
docker compose logs -f otel-collectorVerify logs in HyperDX
Once the collector is running:
- Open HyperDX at http://localhost:8080 (or your ClickStack URL)
- Navigate to the Logs view
- Wait 1-2 minutes for logs to appear (based on your poll interval)
- Search for logs from your CloudWatch log groups
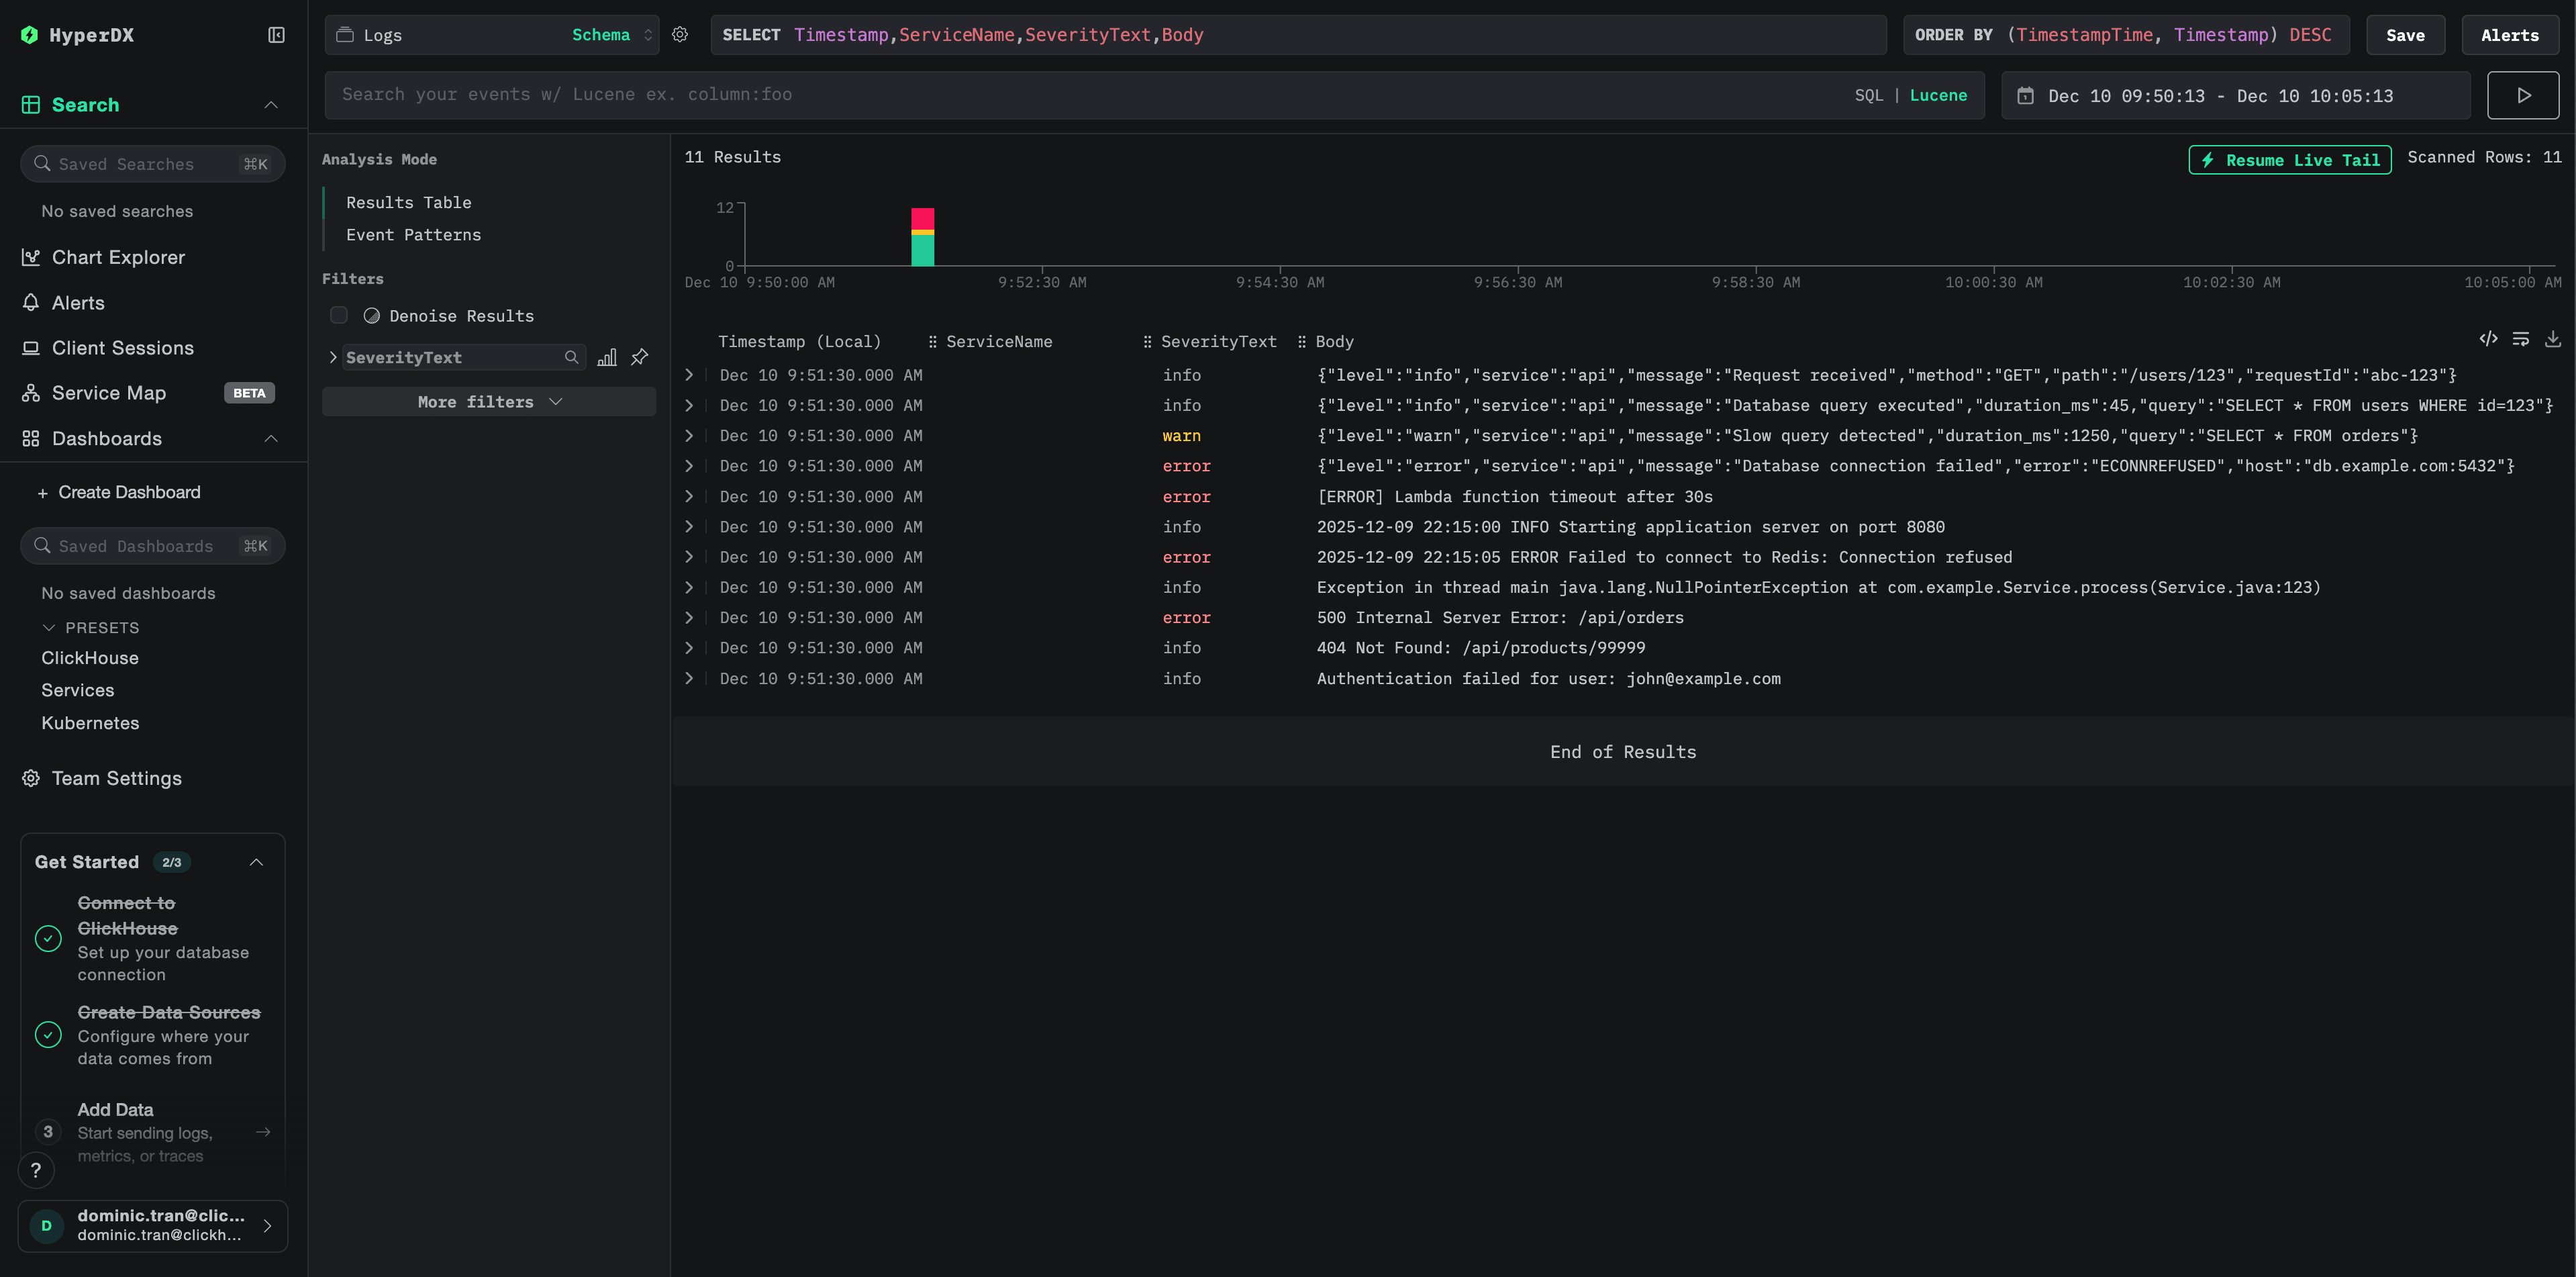
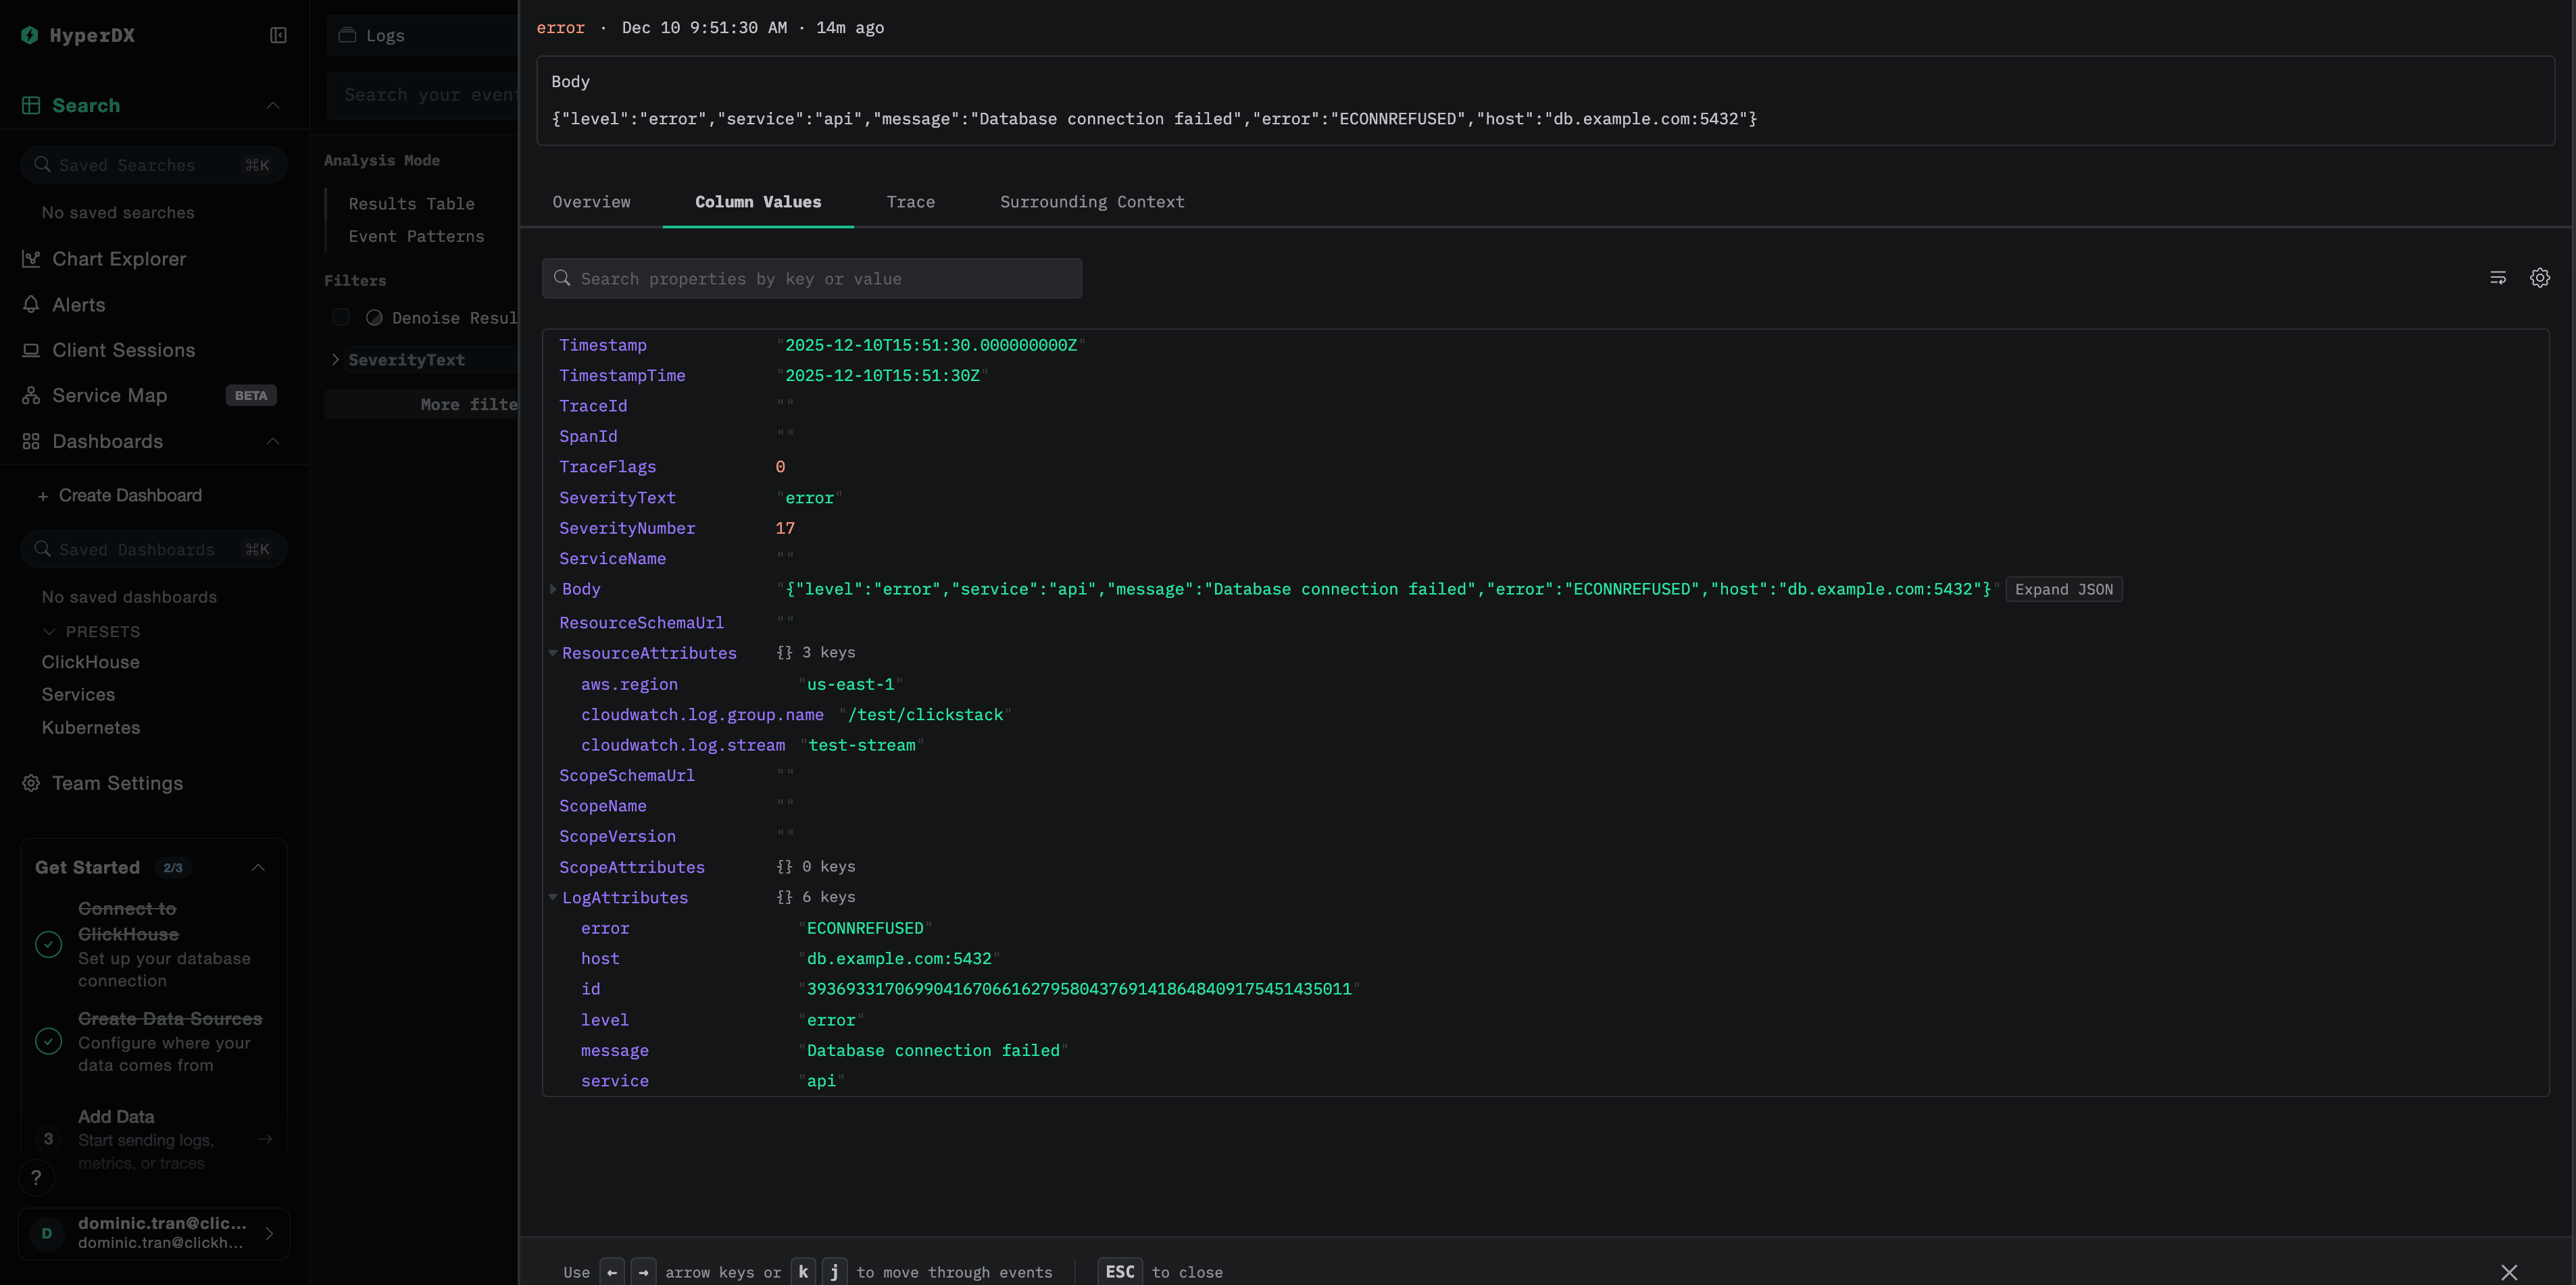
Look for these key attributes in the logs:
ResourceAttributes['aws.region']: Your AWS region (e.g., “us-east-1”)ResourceAttributes['cloudwatch.log.group.name']: The CloudWatch log group nameResourceAttributes['cloudwatch.log.stream']: The log stream nameBody: The actual log message content
Demo dataset
For users who want to test the CloudWatch logs integration before configuring their production AWS environment, we provide a sample dataset with pre-generated logs showing realistic patterns from multiple AWS services.
Download the sample dataset
curl -O https://datasets-documentation.s3.eu-west-3.amazonaws.com/clickstack-integrations/aws/cloudwatch/cloudwatch-logs.jsonlThe dataset includes 24 hours of CloudWatch logs from multiple services:
- Lambda functions: Payment processing, order management, authentication
- ECS services: API gateway with rate limiting and timeouts
- Background jobs: Batch processing with retry patterns
Start ClickStack
If you don’t already have ClickStack running:
docker run -d --name clickstack \
  -p 8080:8080 -p 4317:4317 -p 4318:4318 \
  clickhouse/clickstack-all-in-one:latest
Wait a few moments for ClickStack to fully start up.
Import the demo dataset
docker exec -i clickstack clickhouse-client --query="
  INSERT INTO default.otel_logs FORMAT JSONEachRow
" < cloudwatch-logs.jsonl
This imports the logs directly into ClickStack’s logs table.
Verify the demo data
Once imported:
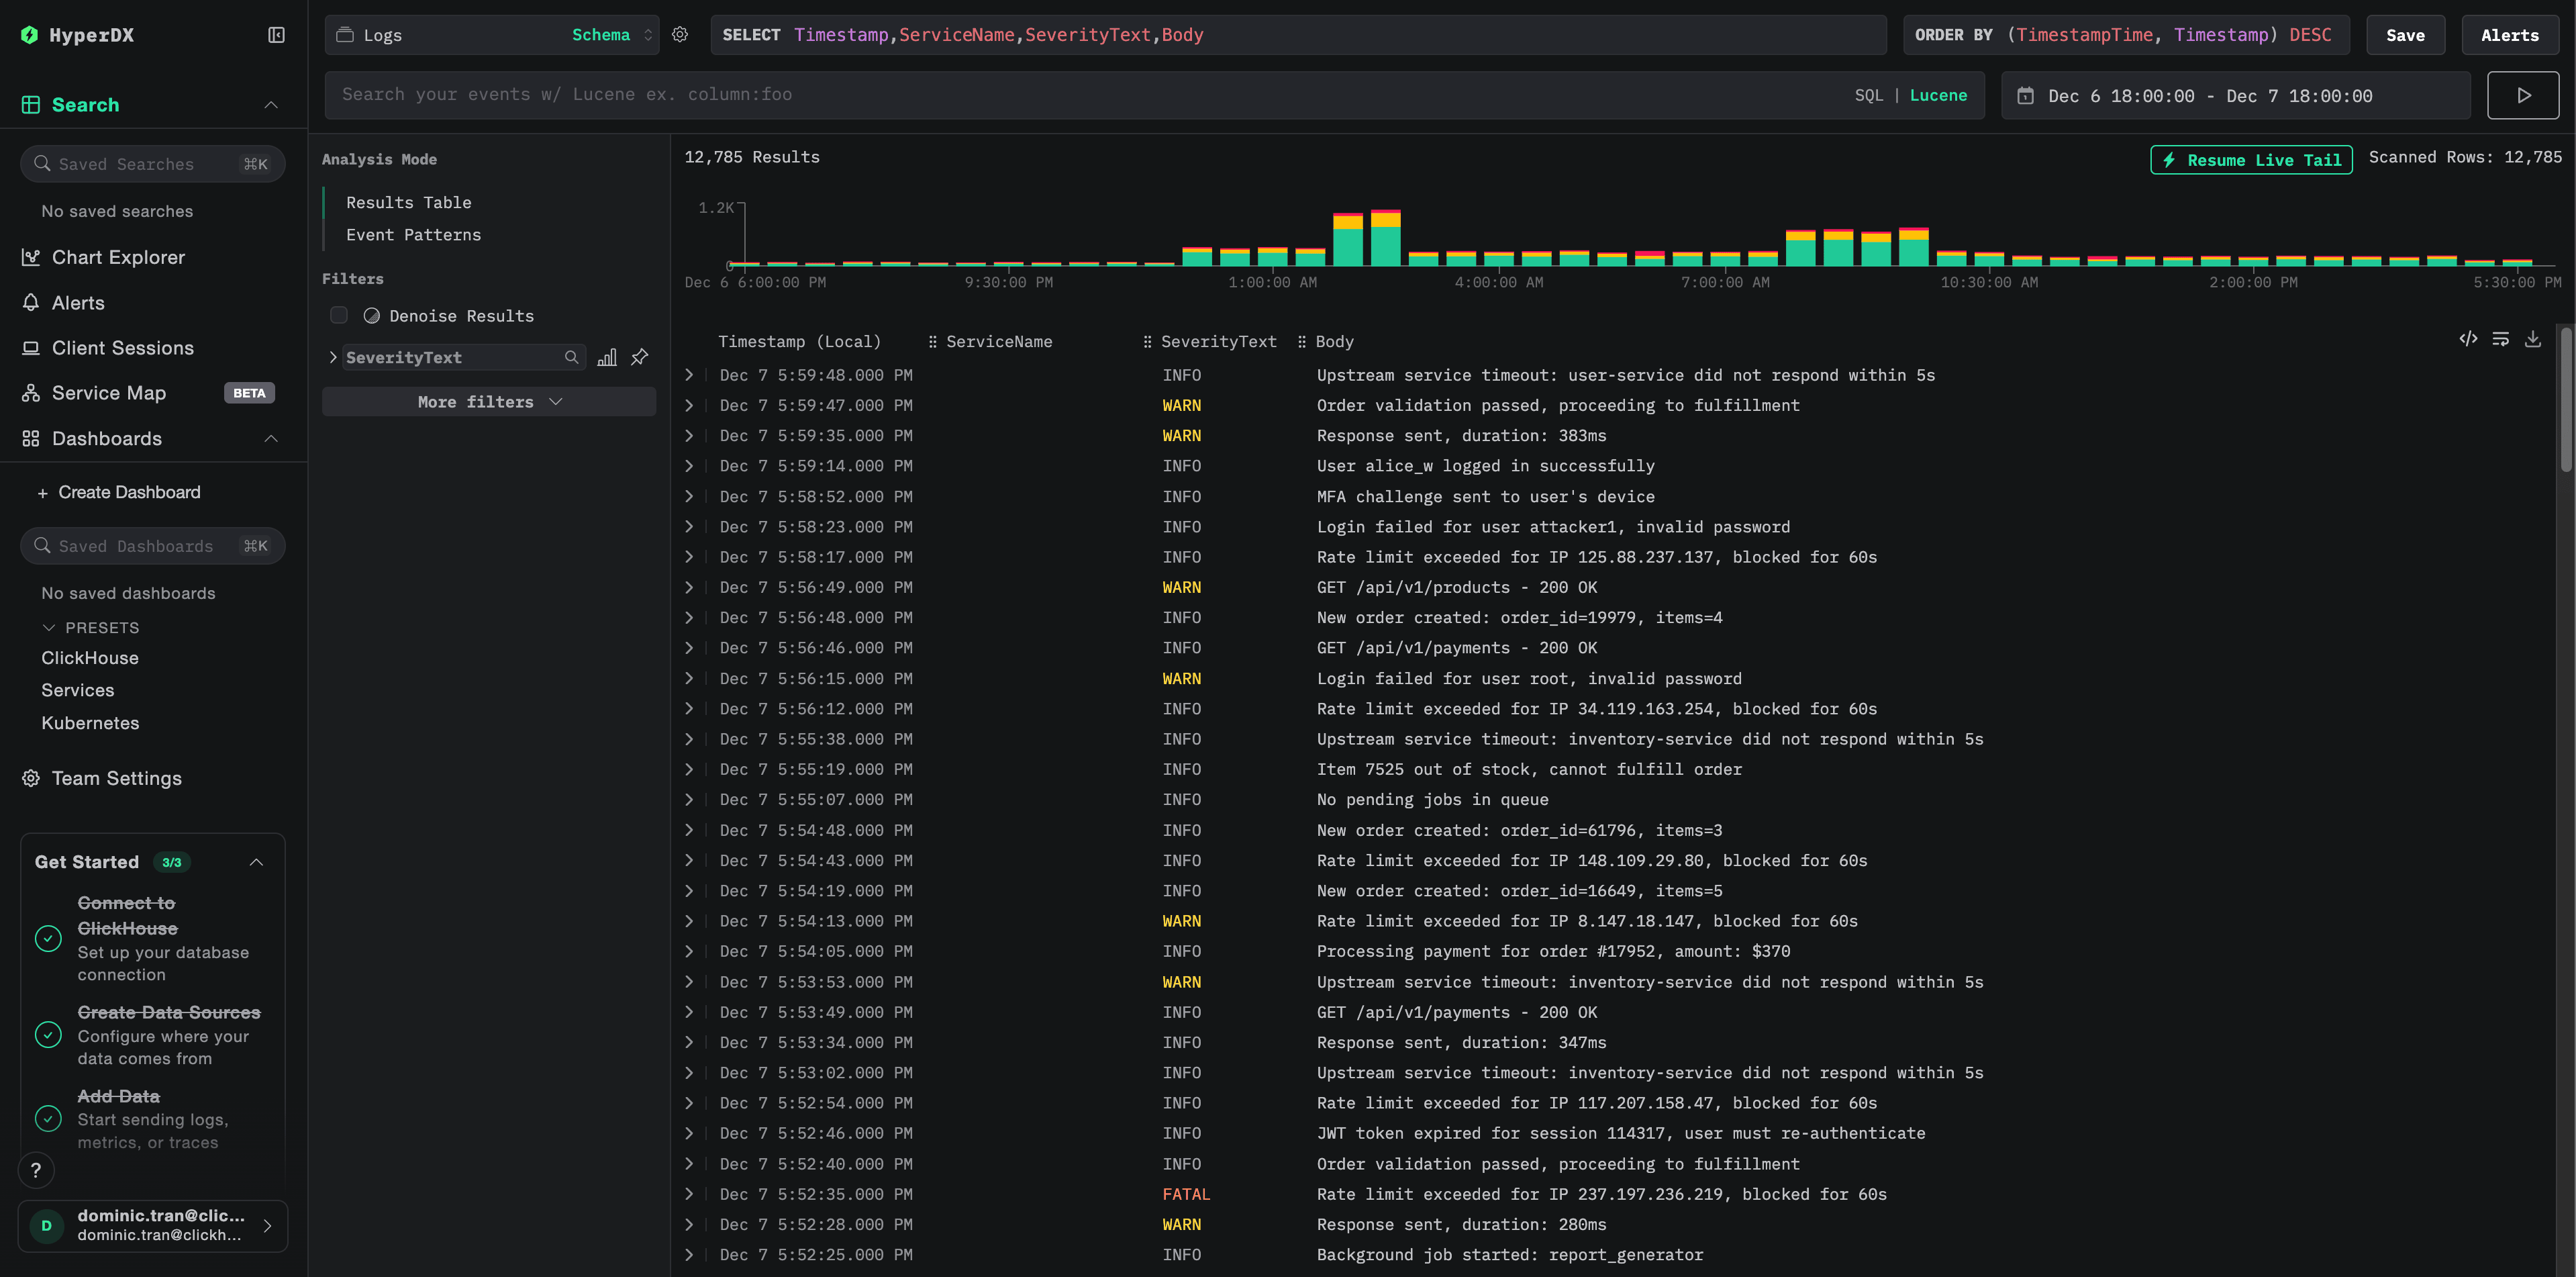
- Open HyperDX at http://localhost:8080 and log in (create an account if needed)
- Navigate to the Logs view
- Set the time range to 2025-12-07 00:00:00 - 2025-12-08 00:00:00 (UTC)
- Search for
cloudwatch-demoor filter byLogAttributes['source'] = 'cloudwatch-demo'
You should see logs from multiple CloudWatch log groups.
Dashboards and visualization
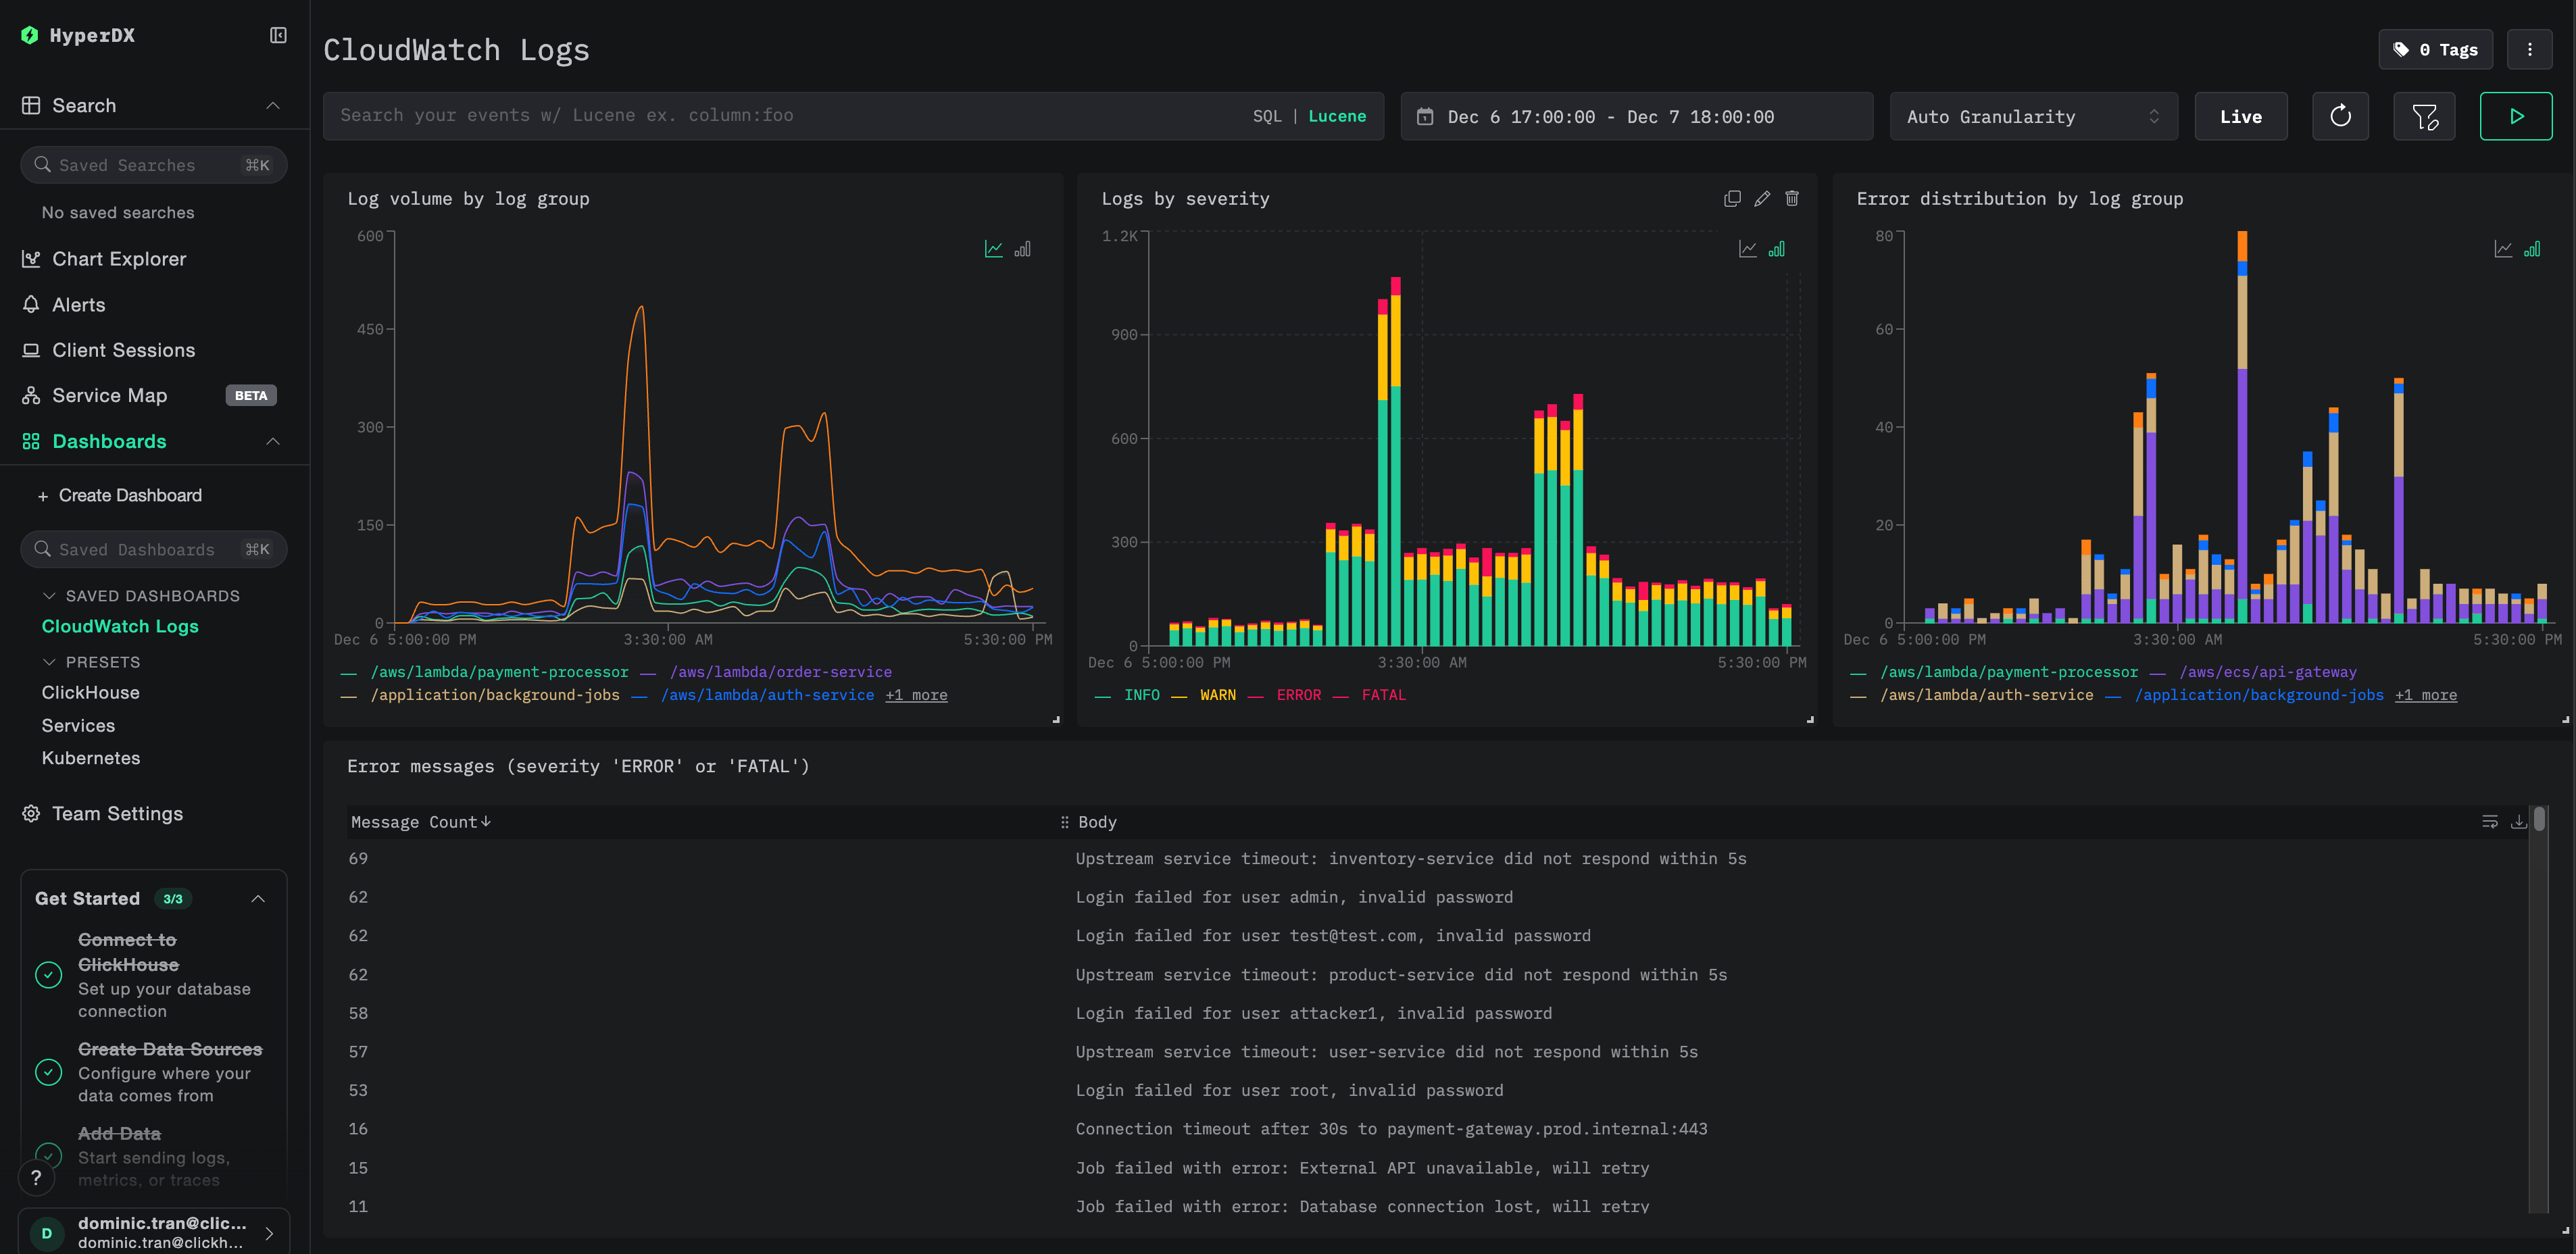
To help you monitor CloudWatch logs with ClickStack, we provide a pre-built dashboard with essential visualizations.
Download the dashboard configuration
Import the dashboard
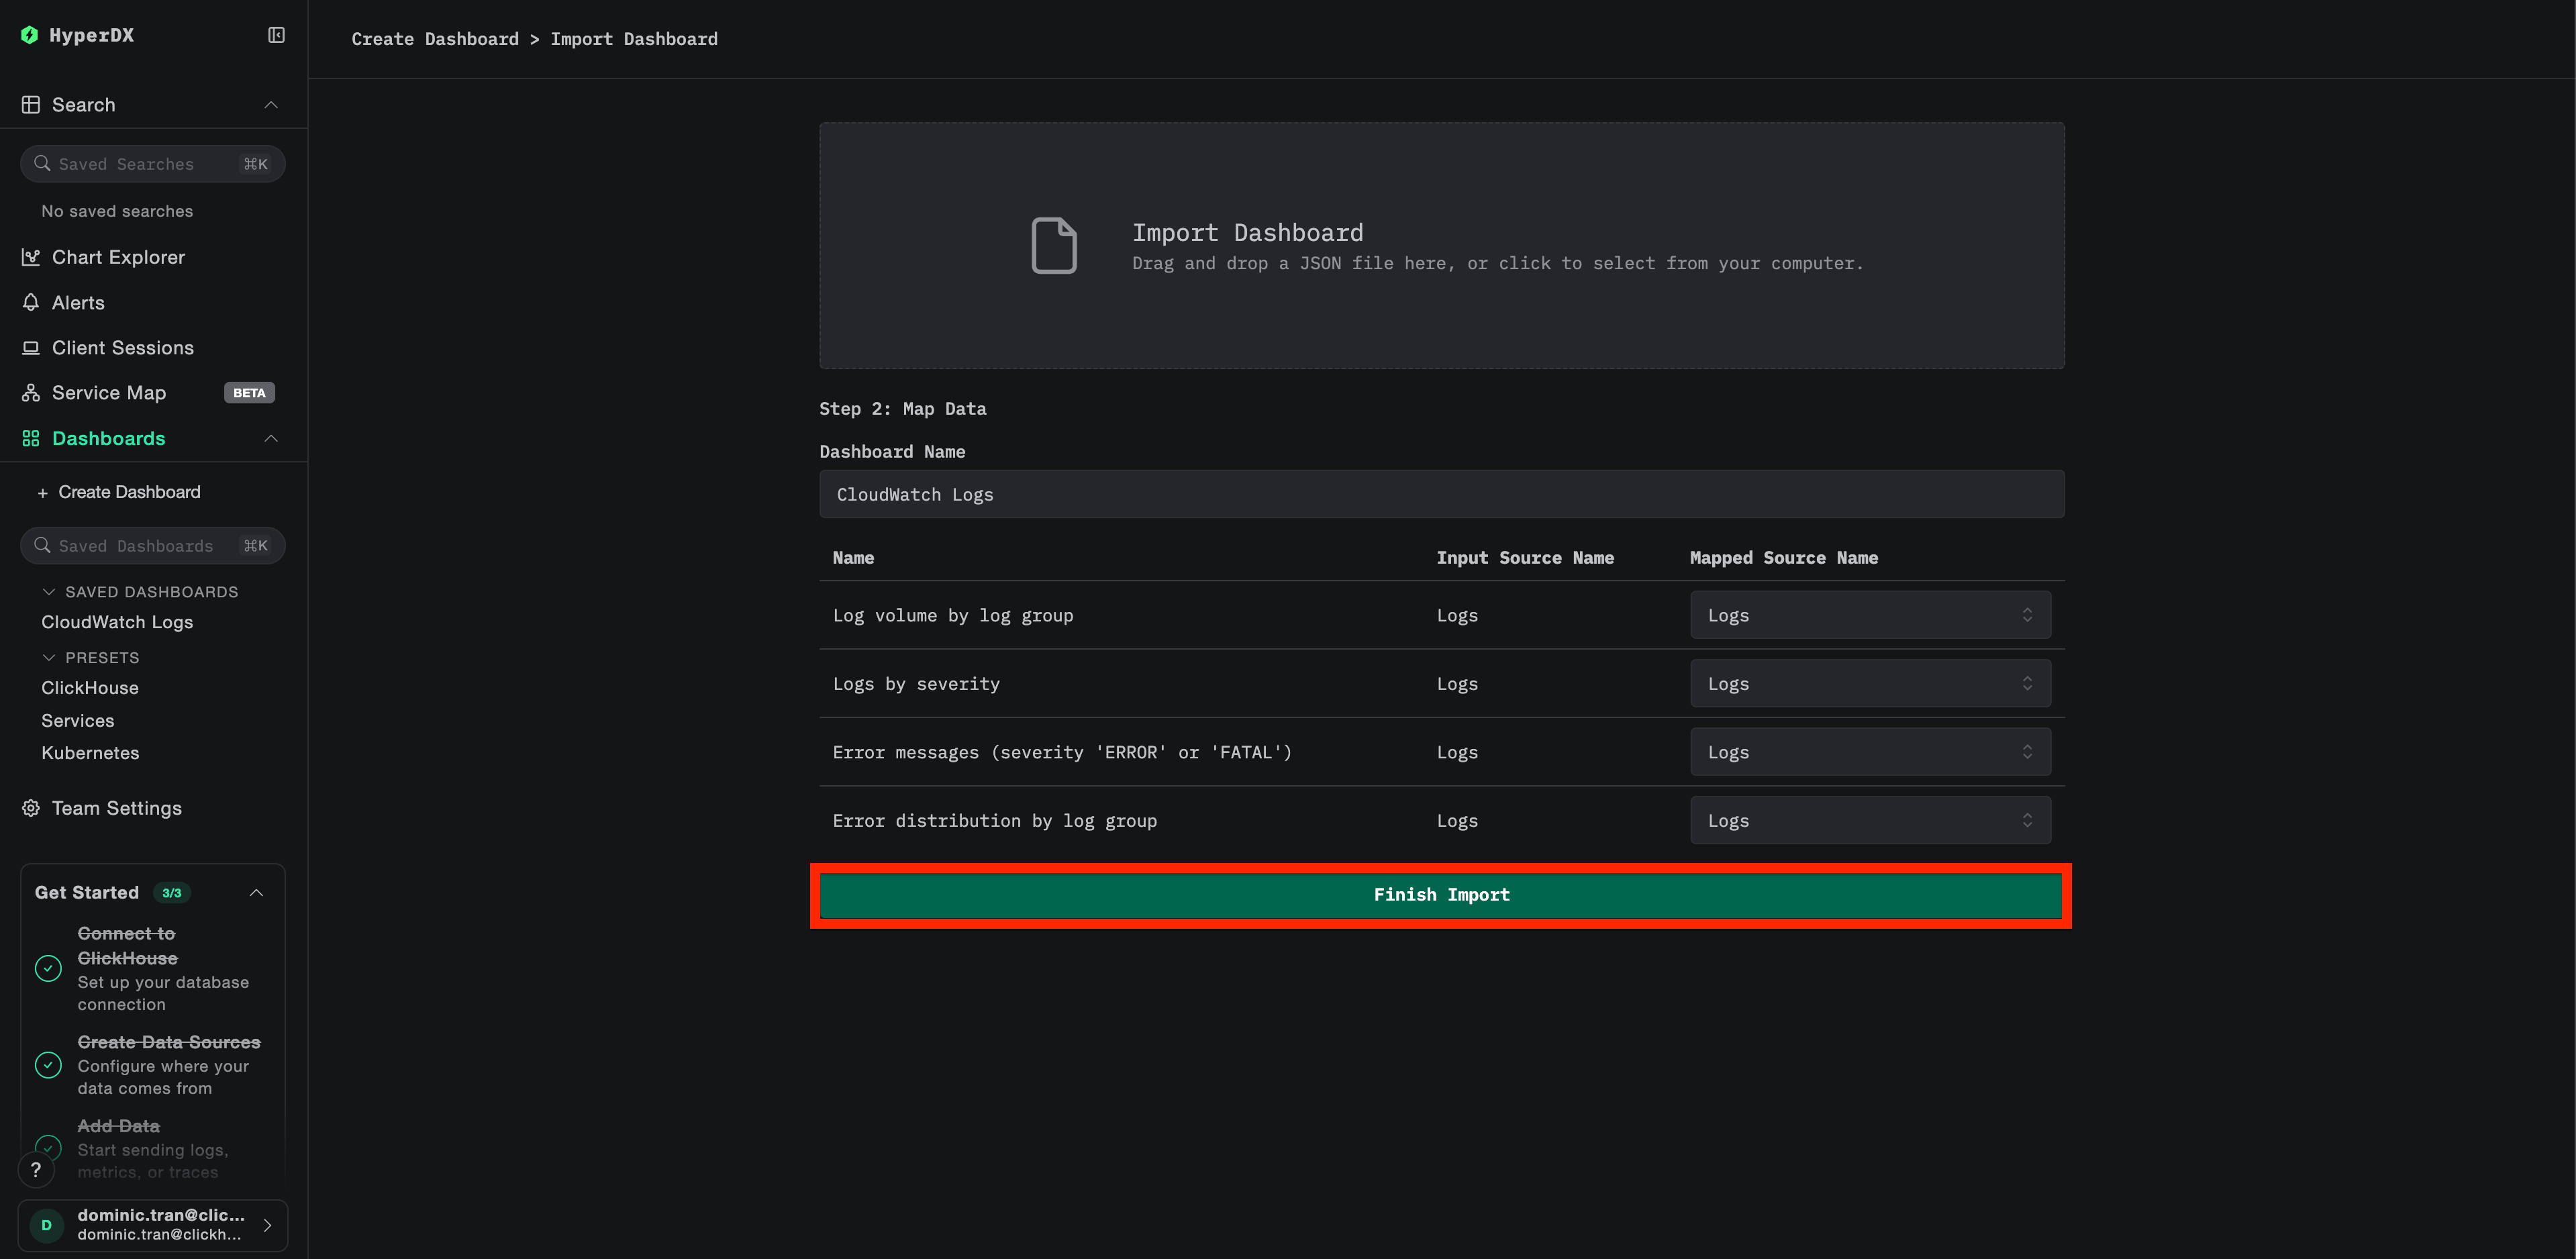
- Open HyperDX and navigate to the Dashboards section
- Click Import Dashboard in the upper right corner under the ellipses

- Upload the
cloudwatch-logs-dashboard.jsonfile and click Finish Import
View the dashboard
The dashboard will be created with all visualizations pre-configured:
Troubleshooting
No logs appearing in HyperDX
Verify AWS credentials are configured:
aws sts get-caller-identityIf this fails, your credentials are invalid or expired.
Check IAM permissions:
Ensure your AWS credentials have the required logs:DescribeLogGroups and logs:FilterLogEvents permissions.
Check collector logs for errors:
# If using Docker directly, logs appear in stdout
# If using Docker Compose:
docker compose logs otel-collector
Common errors:
The security token included in the request is invalid: Credentials are invalid or expired. For temporary credentials (SSO), ensureAWS_SESSION_TOKENis set.operation error CloudWatch Logs: FilterLogEvents, AccessDeniedException: IAM permissions are insufficientfailed to refresh cached credentials, no EC2 IMDS role found: AWS credentials environment variables aren’t setconnection refused: ClickStack endpoint is unreachable
Verify CloudWatch log groups exist and have recent logs:
# List your log groups
aws logs describe-log-groups --region us-east-1

# Check if a specific log group has recent logs (last hour)
aws logs filter-log-events \
  --log-group-name /aws/lambda/my-function \
  --region us-east-1 \
  --start-time $(date -u -v-1H +%s)000 \
  --max-items 5
Only seeing old logs or missing recent logs
The CloudWatch receiver starts from “now” by default:
When the collector first starts, it creates a checkpoint at the current time and only fetches logs after that point. Historical logs aren’t retrieved.
To collect recent historical logs:
Stop and remove the collector’s checkpoint, then restart:
# Stop the collector
docker stop <container-id>

# Restart fresh (checkpoints are stored in container, so removing it resets)
docker run --rm ...
The receiver will create a new checkpoint and fetch logs from the current time forward.
Invalid security token / credentials expired
If using temporary credentials (AWS SSO, assumed role), they expire after a period of time.
Re-export fresh credentials:
# For SSO users:
aws sso login --profile YOUR_PROFILE_NAME
eval $(aws configure export-credentials --profile YOUR_PROFILE_NAME --format env)

# For IAM users:
export AWS_ACCESS_KEY_ID="your-key"
export AWS_SECRET_ACCESS_KEY="your-secret"

# Restart the collector
docker restart <container-id>
High latency or missing recent logs
Reduce poll interval:
The default poll_interval is 1 minute. For near-real-time logs, reduce it:
logs:
  poll_interval: 30s  # Poll every 30 seconds
Note: Lower poll intervals increase AWS API calls and may incur higher CloudWatch API costs.
Collector using too much memory
Reduce batch size or increase timeout:
processors:
  batch:
    timeout: 5s
    send_batch_size: 100
Limit autodiscovery:
groups:
  autodiscover:
    limit: 50  # Reduce from 100 to 50
Next steps
- Set up alerts for critical events (connection failures, error spikes)
- Reduce CloudWatch costs by adjusting retention periods or archiving to S3, now that you have logs in ClickStack
- Filter noisy log groups by removing them from the collector configuration to reduce ingestion volume
Going to production
This guide demonstrates running the OpenTelemetry Collector locally with Docker Compose for testing. For production deployments, run the collector on infrastructure with AWS access (EC2 with IAM roles, EKS with IRSA, or ECS with task roles) to eliminate the need for managing access keys. Deploy collectors in the same AWS region as your CloudWatch log groups to reduce latency and costs.
See Ingesting with OpenTelemetry for production deployment patterns and collector configuration examples.