

 Set up docs MCP
Integration with existing systems
Monitor your existing Linux system’s journald logs by running the OpenTelemetry Collector with the journald receiver to collect system logs and send them to ClickStack via OTLP.
If you want to test this integration first without modifying your existing setup, skip to the demo dataset section.
Prerequisites
- ClickStack instance running
- Linux system with systemd (Ubuntu 16.04+, CentOS 7+, Debian 8+)
- Docker or Docker Compose installed on the monitored system
Get ClickStack API key
The OpenTelemetry Collector sends data to ClickStack’s OTLP endpoint, which requires authentication.
- Open HyperDX at your ClickStack URL (e.g., http://localhost:8080)
- Create an account or log in if needed
- Navigate to Team Settings → API Keys
- Copy your Ingestion API Key
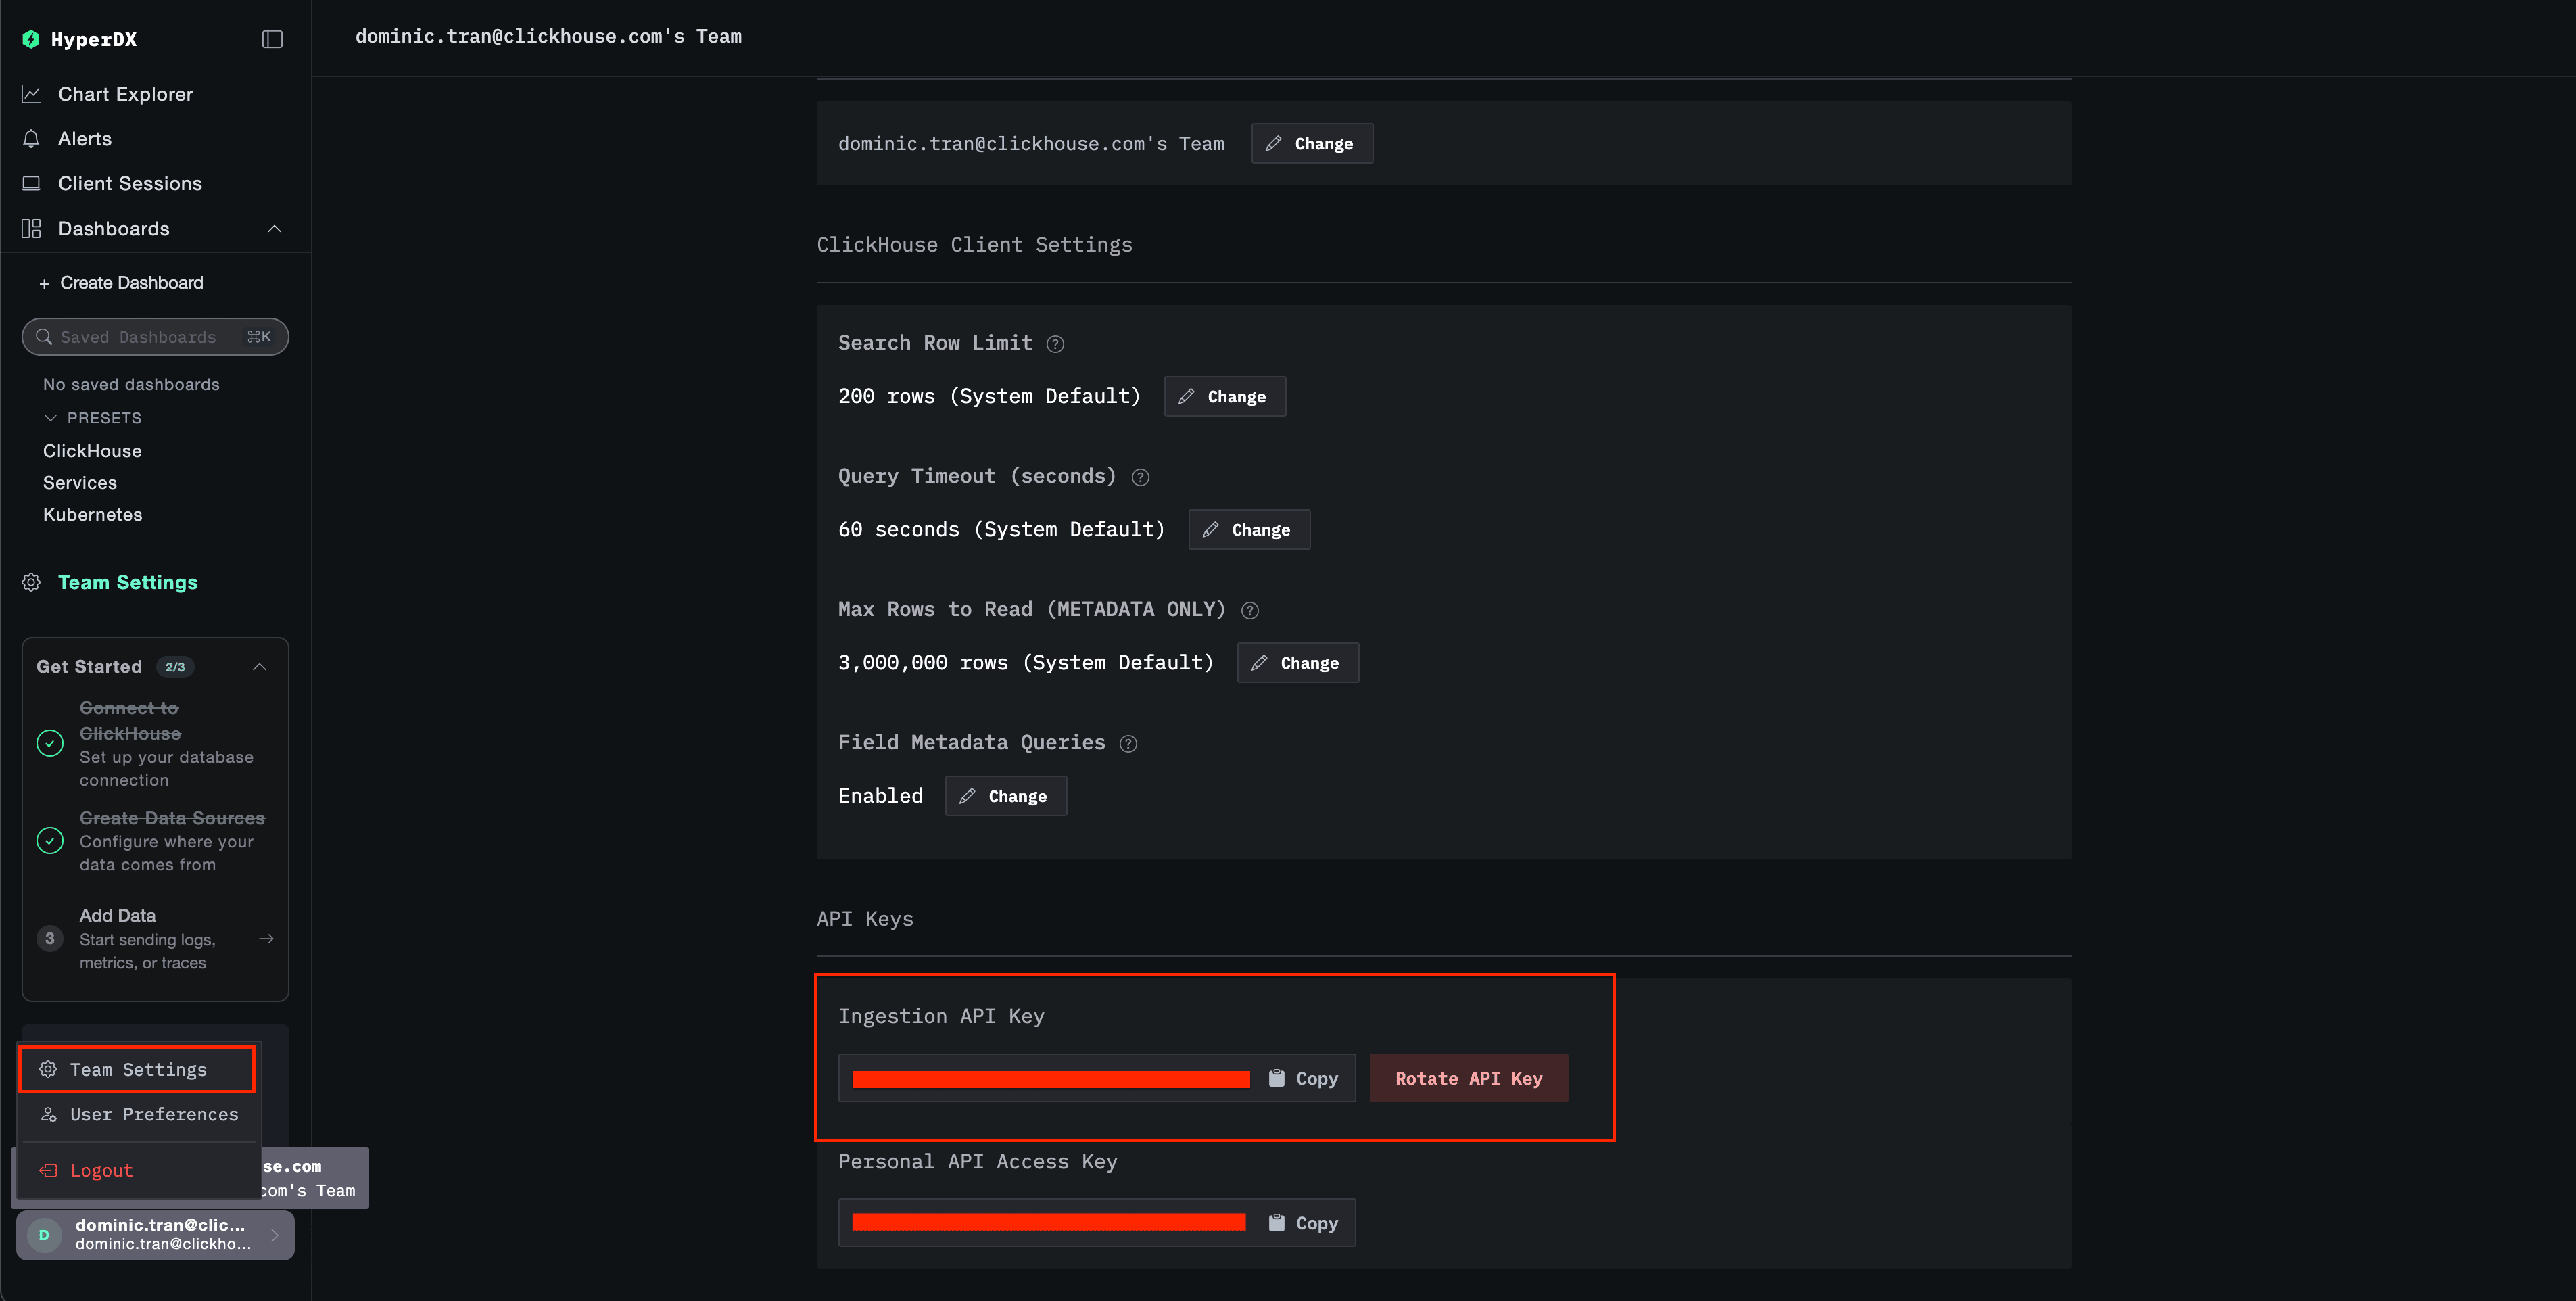
- Set it as an environment variable:
export CLICKSTACK_API_KEY=your-api-key-hereVerify systemd journal is running
Ensure your system is using systemd and has journal logs:
# Check systemd version
systemctl --version

# View recent journal entries
journalctl -n 20

# Check journal disk usage
journalctl --disk-usage
If journal storage is in memory only, enable persistent storage:
sudo mkdir -p /var/log/journal
sudo systemd-tmpfiles --create --prefix /var/log/journal
sudo systemctl restart systemd-journald
Create OpenTelemetry Collector configuration
Create a configuration file for the OpenTelemetry Collector:
cat > otel-config.yaml << 'EOF'
receivers:
  journald:
    directory: /var/log/journal
    priority: info
    units:
      - sshd
      - nginx
      - docker
      - containerd
      - systemd

processors:
  batch:
    timeout: 10s
    send_batch_size: 10000

  resource:
    attributes:
      - key: service.name
        value: systemd-logs
        action: insert
      - key: host.name
        from_attribute: _HOSTNAME
        action: upsert

  attributes:
    actions:
      - key: unit
        from_attribute: _SYSTEMD_UNIT
        action: upsert
      - key: priority
        from_attribute: PRIORITY
        action: upsert

exporters:
  otlphttp:
    endpoint: ${CLICKSTACK_ENDPOINT}
    headers:
      authorization: ${CLICKSTACK_API_KEY}

service:
  pipelines:
    logs:
      receivers: [journald]
      processors: [resource, attributes, batch]
      exporters: [otlphttp]
EOF
Deploy with Docker Compose
This example shows deploying the OTel Collector alongside ClickStack:
services:
  clickstack:
    image: clickhouse/clickstack-all-in-one:latest
    ports:
      - "8080:8080"
      - "4317:4317"
      - "4318:4318"
    networks:
      - monitoring

  otel-collector:
    image: otel/opentelemetry-collector-contrib:0.115.1
    depends_on:
      - clickstack
    environment:
      - CLICKSTACK_API_KEY=${CLICKSTACK_API_KEY}
      - CLICKSTACK_ENDPOINT=http://clickstack:4318
    volumes:
      - ./otel-config.yaml:/etc/otelcol/config.yaml:ro
      - /var/log/journal:/var/log/journal:ro
      - /run/log/journal:/run/log/journal:ro
      - /etc/machine-id:/etc/machine-id:ro
    command: ["--config=/etc/otelcol/config.yaml"]
    networks:
      - monitoring

networks:
  monitoring:
    driver: bridge
Start the services:
docker compose up -dVerify logs in HyperDX
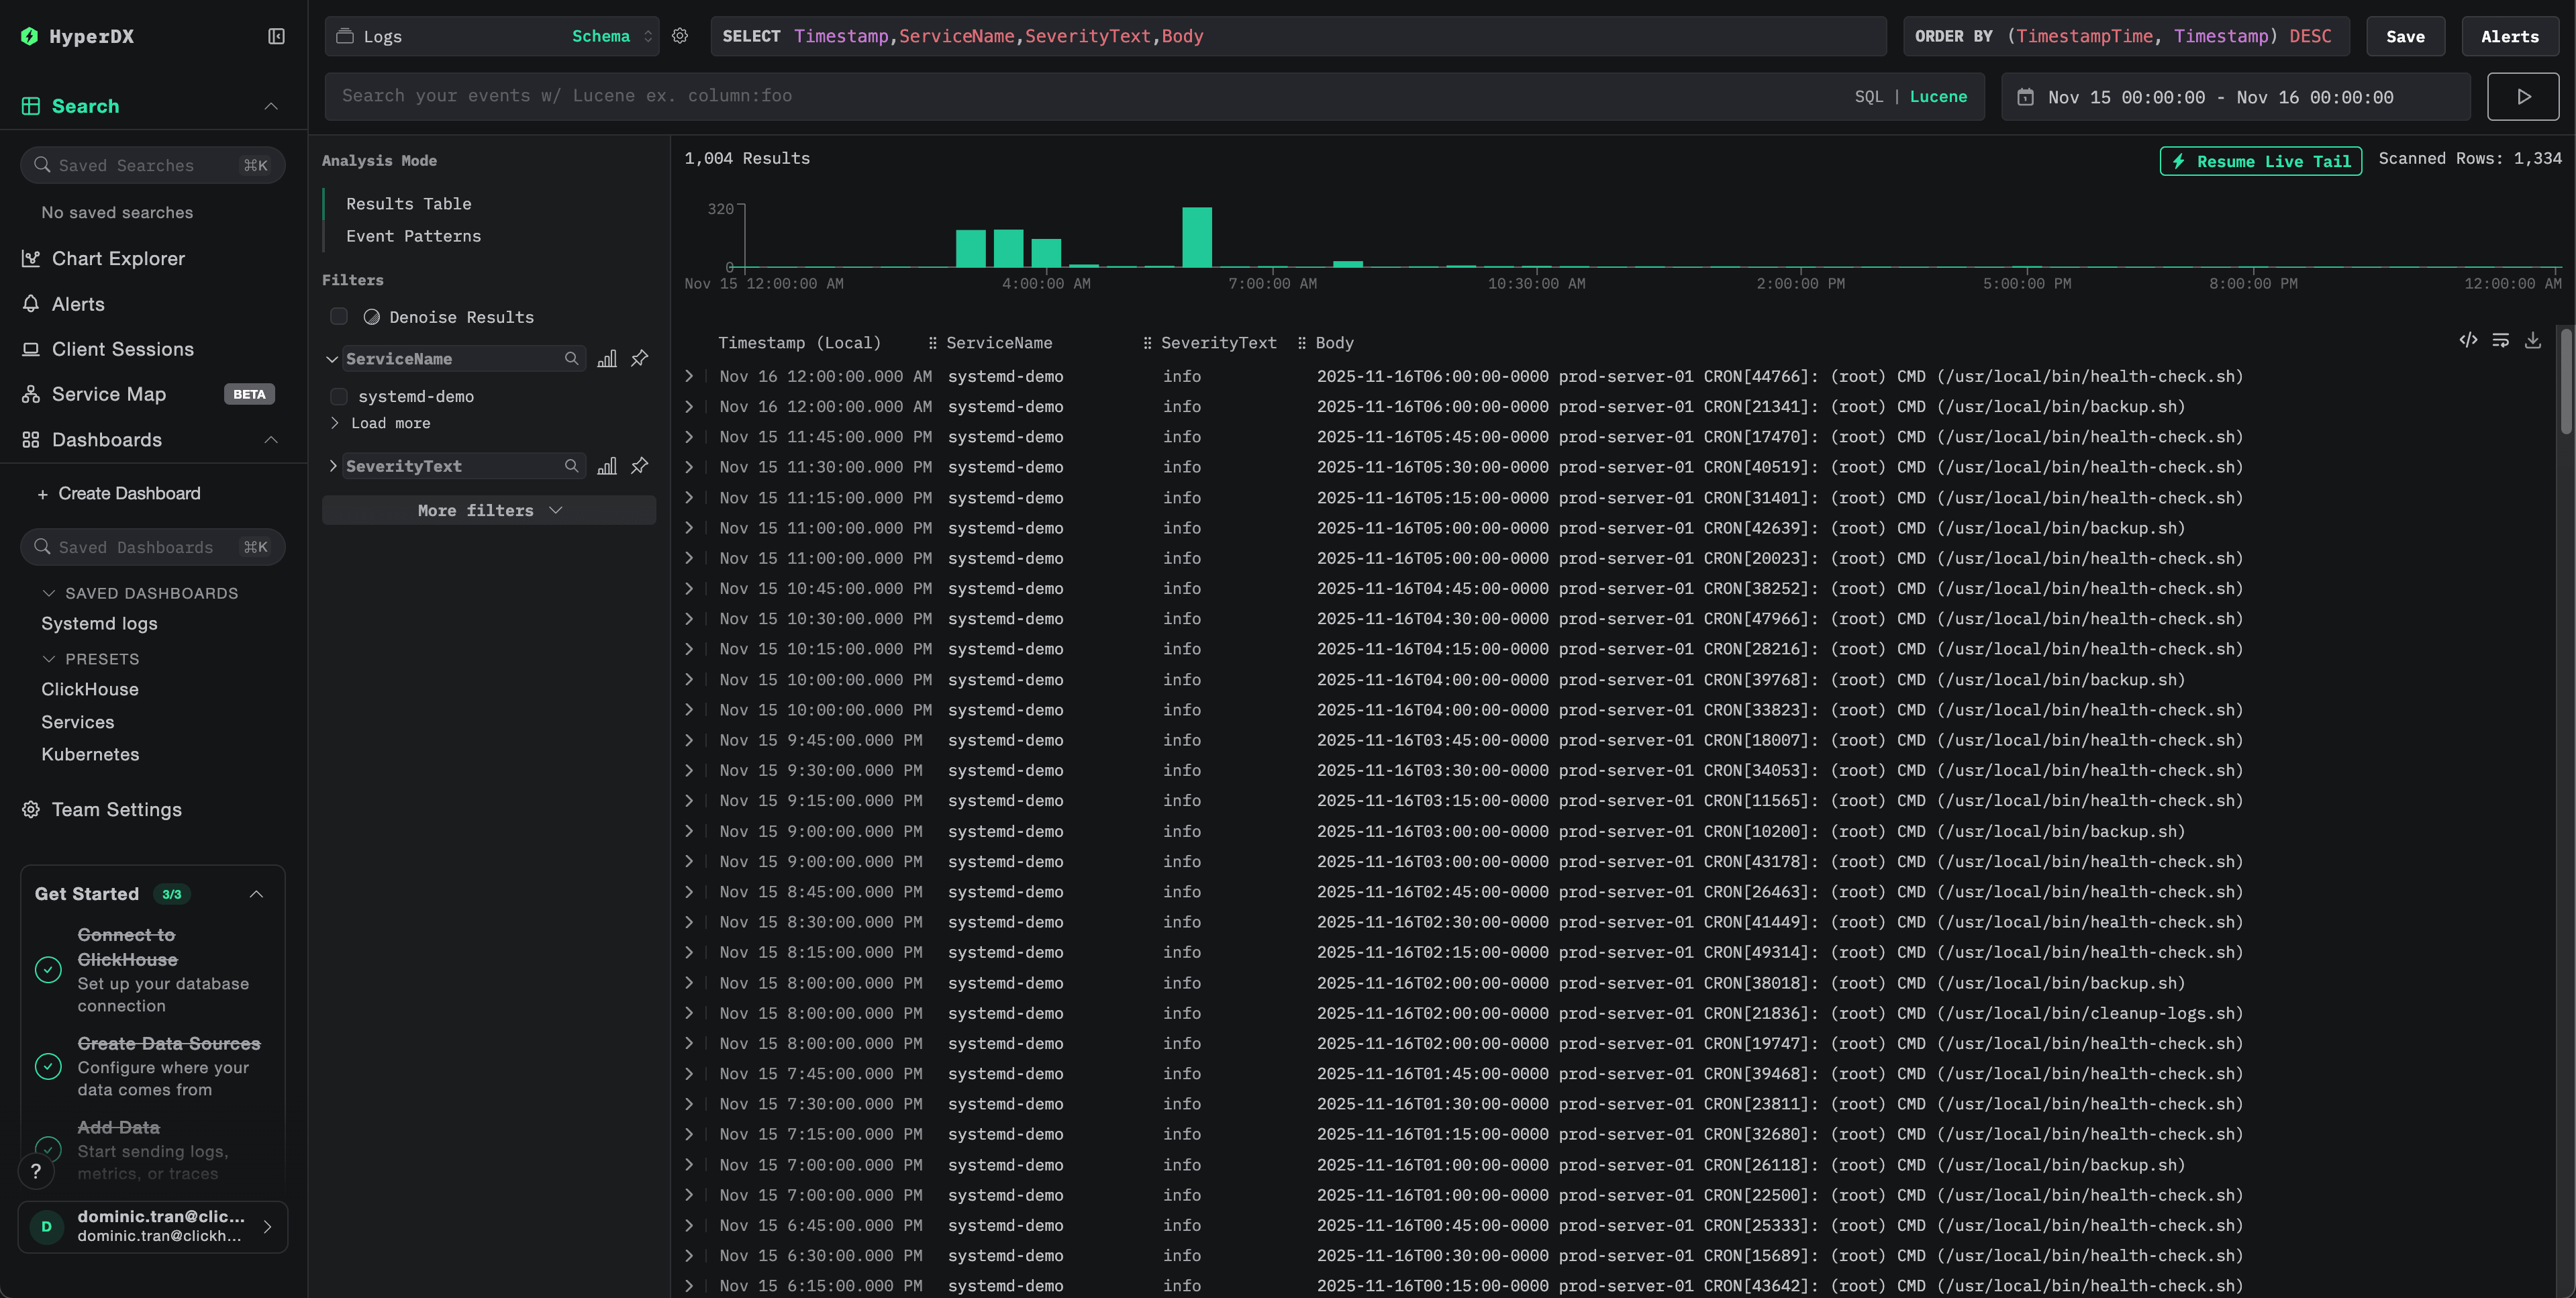
Once configured, log into HyperDX and verify logs are flowing:
- Navigate to the Search view
- Set source to Logs
- Filter by
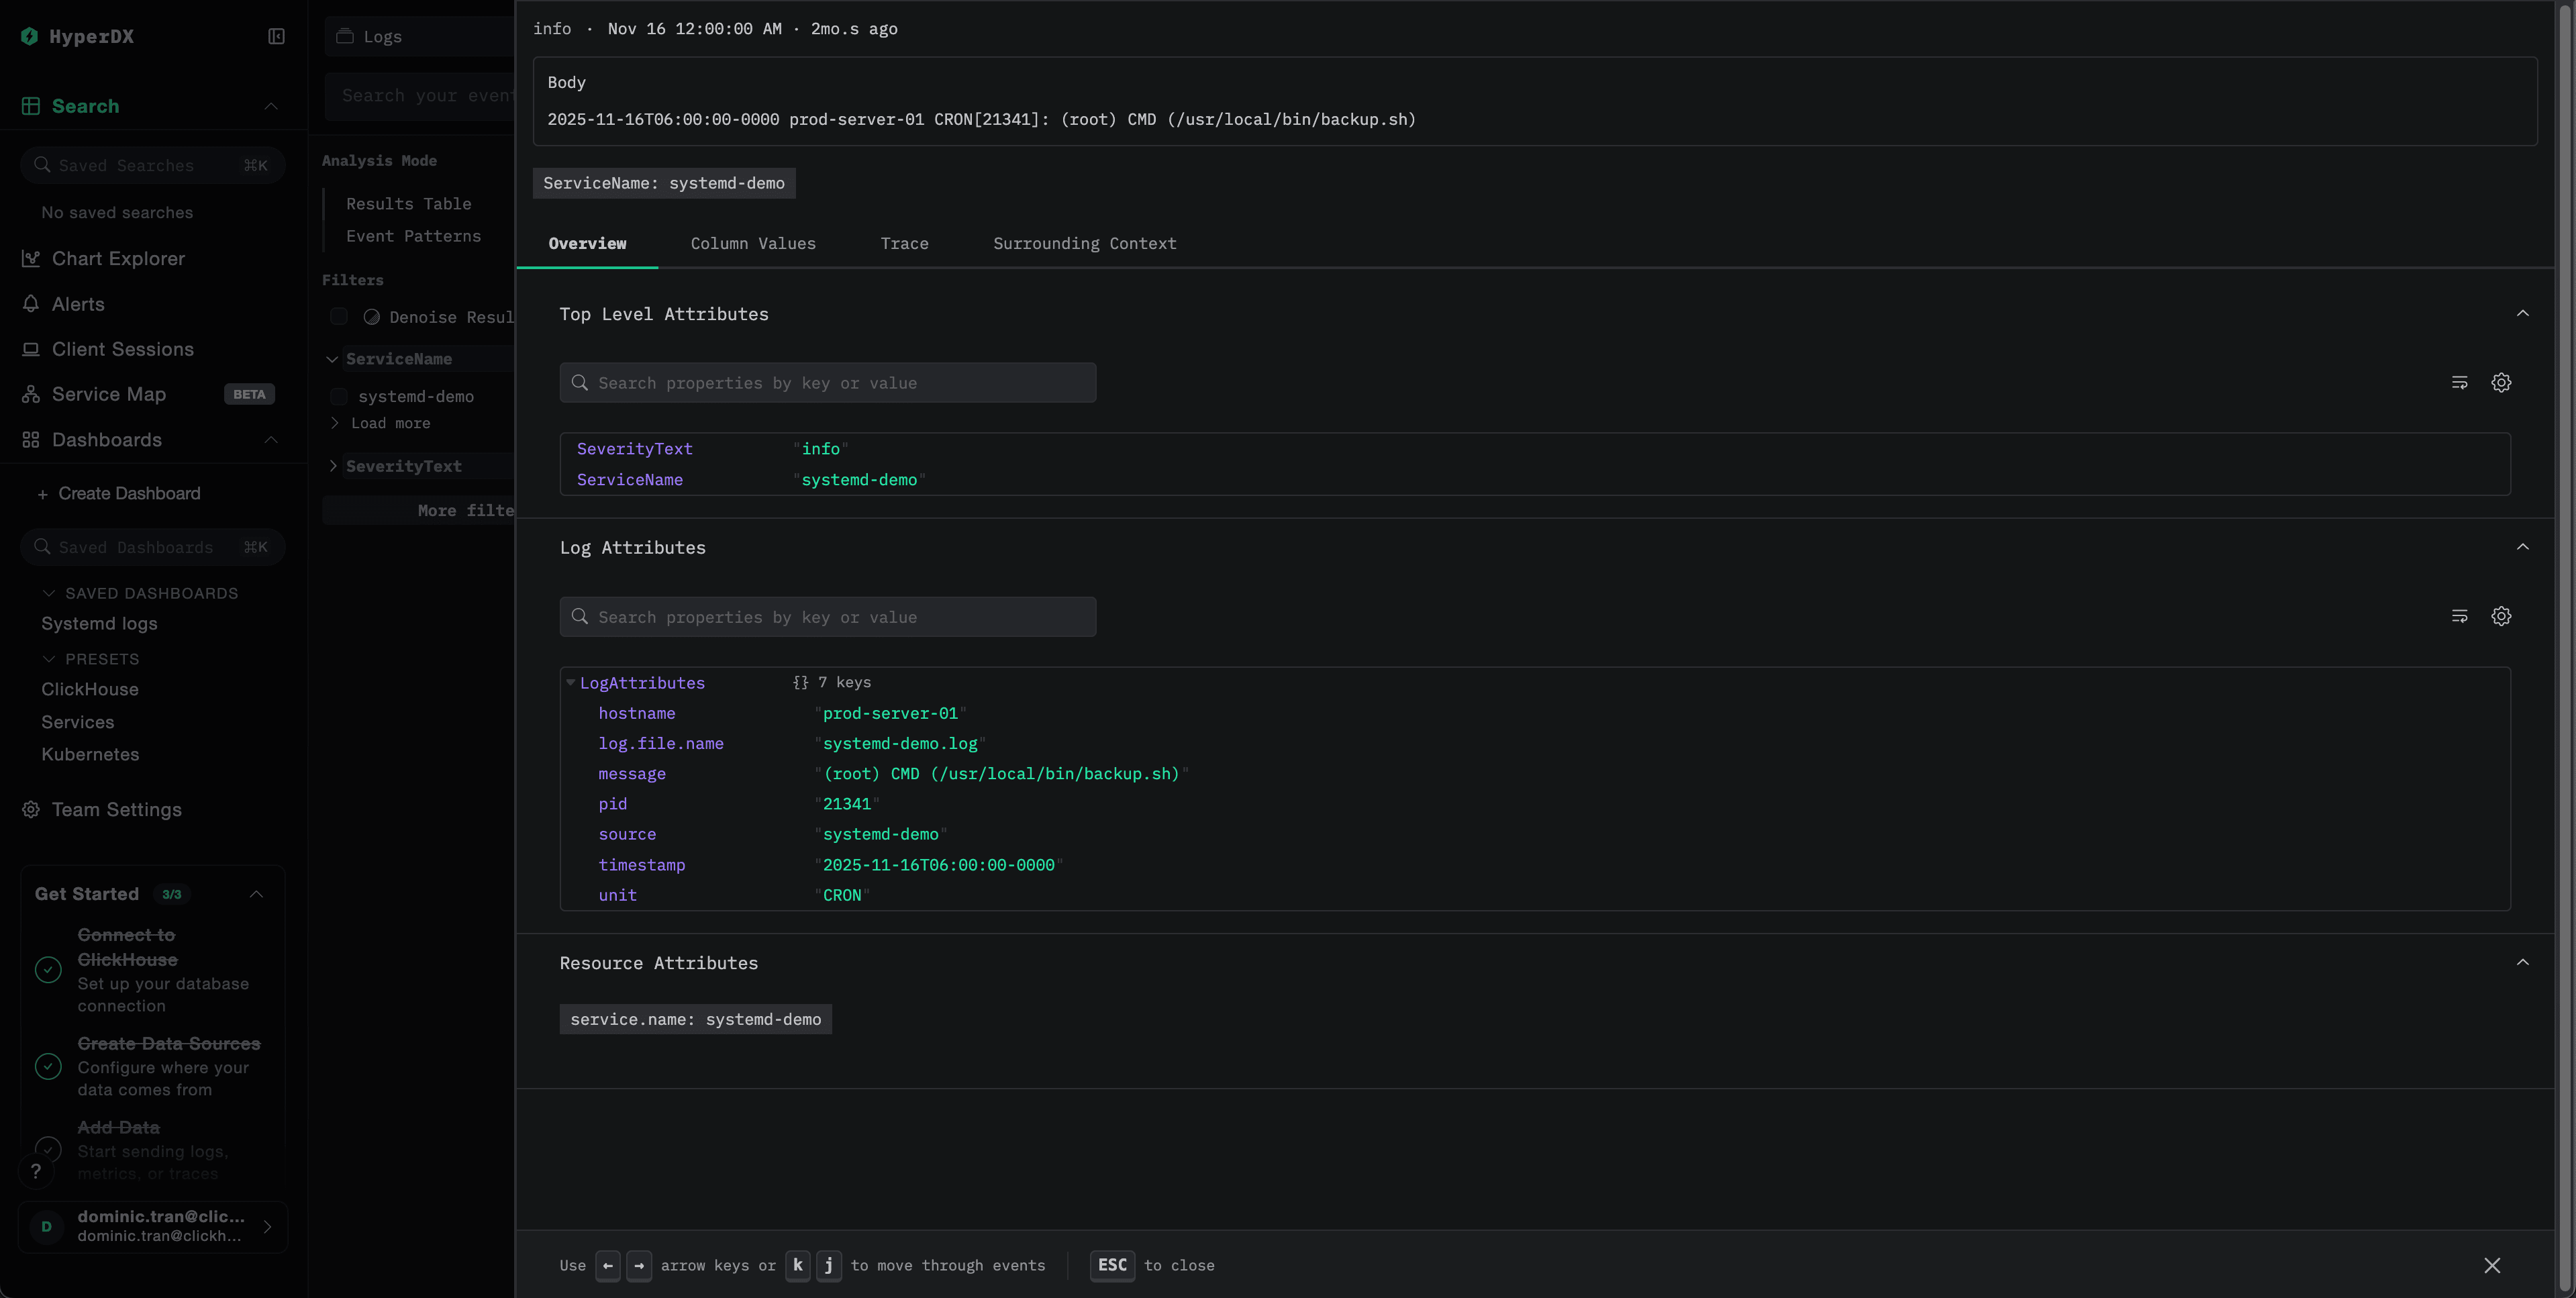
service.name:systemd-logs - You should see structured log entries with fields like
unit,priority,MESSAGE,_HOSTNAME
Demo dataset
For users who want to test the systemd logs integration before configuring their production systems, we provide a sample dataset of pre-generated systemd logs with realistic patterns.
Download the sample dataset
Download the sample log file:
curl -O https://datasets-documentation.s3.eu-west-3.amazonaws.com/clickstack-integrations/systemd/systemd-demo.logCreate demo collector configuration
Create a configuration file for the demo:
cat > systemd-demo.yaml << 'EOF'
receivers:
  filelog:
    include:
      - /tmp/systemd-demo/systemd-demo.log
    start_at: beginning
    operators:
      - type: regex_parser
        regex: '^(?P<timestamp>\S+) (?P<hostname>\S+) (?P<unit>\S+?)(?:\[(?P<pid>\d+)\])?: (?P<message>.*)$'
        parse_from: body
        parse_to: attributes
      - type: time_parser
        parse_from: attributes.timestamp
        layout: '%Y-%m-%dT%H:%M:%S%z'
      - type: add
        field: attributes.source
        value: "systemd-demo"

service:
  pipelines:
    logs/systemd-demo:
      receivers: [filelog]
      processors:
        - memory_limiter
        - transform
        - batch
      exporters:
        - clickhouse
EOF
Run ClickStack with demo data
Start ClickStack with the demo logs:
docker run -d --name clickstack-demo \
  -p 8080:8080 -p 4317:4317 -p 4318:4318 \
  -e CUSTOM_OTELCOL_CONFIG_FILE=/etc/otelcol-contrib/custom.config.yaml \
  -v "$(pwd)/systemd-demo.yaml:/etc/otelcol-contrib/custom.config.yaml:ro" \
  -v "$(pwd)/systemd-demo.log:/tmp/systemd-demo/systemd-demo.log:ro" \
clickhouse/clickstack-all-in-one:latestVerify logs in HyperDX
Once ClickStack is running:
- Open HyperDX and log in to your account
- Navigate to the Search view and set the source to
Logs - Set the time range to 2025-11-14 00:00:00 - 2025-11-17 00:00:00
Dashboards and visualization
To help you get started monitoring systemd logs with ClickStack, we provide essential visualizations for systemd journal data.
Download the dashboard configuration
Import the pre-built dashboard
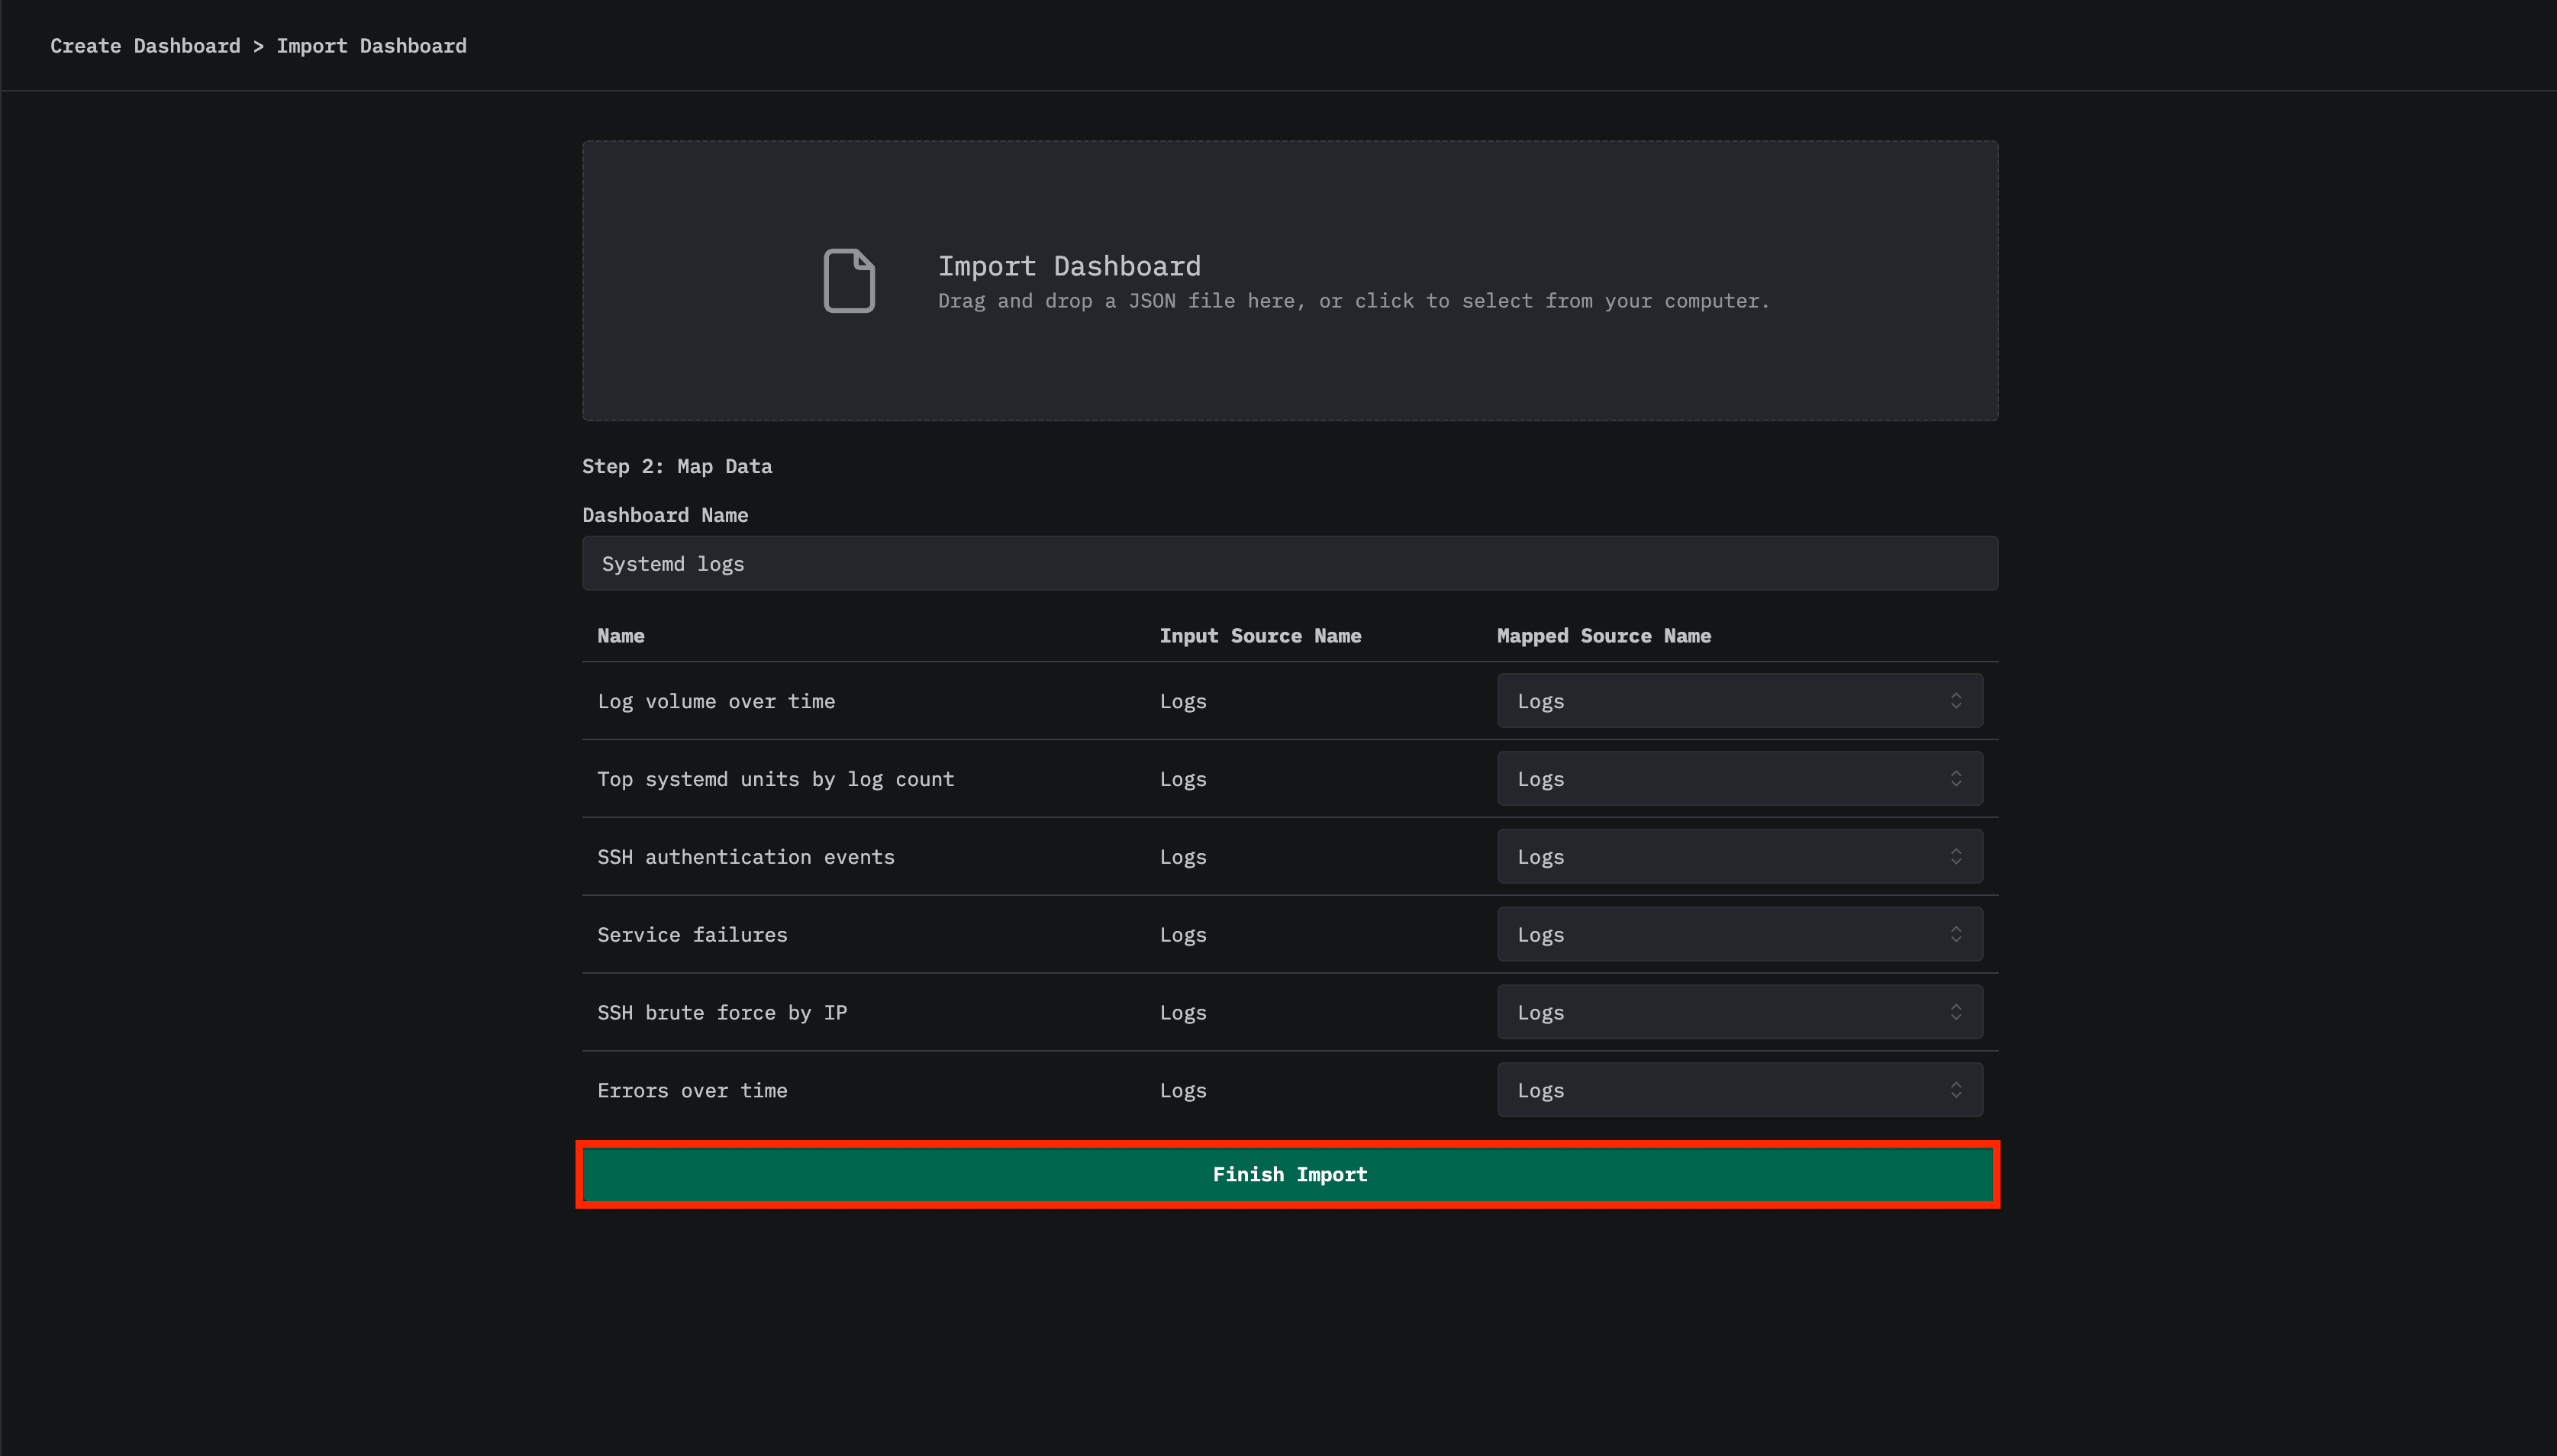
- Open HyperDX and navigate to the Dashboards section
- Click Import Dashboard in the upper right corner under the ellipses

- Upload the
systemd-logs-dashboard.jsonfile and click Finish Import
View the dashboard
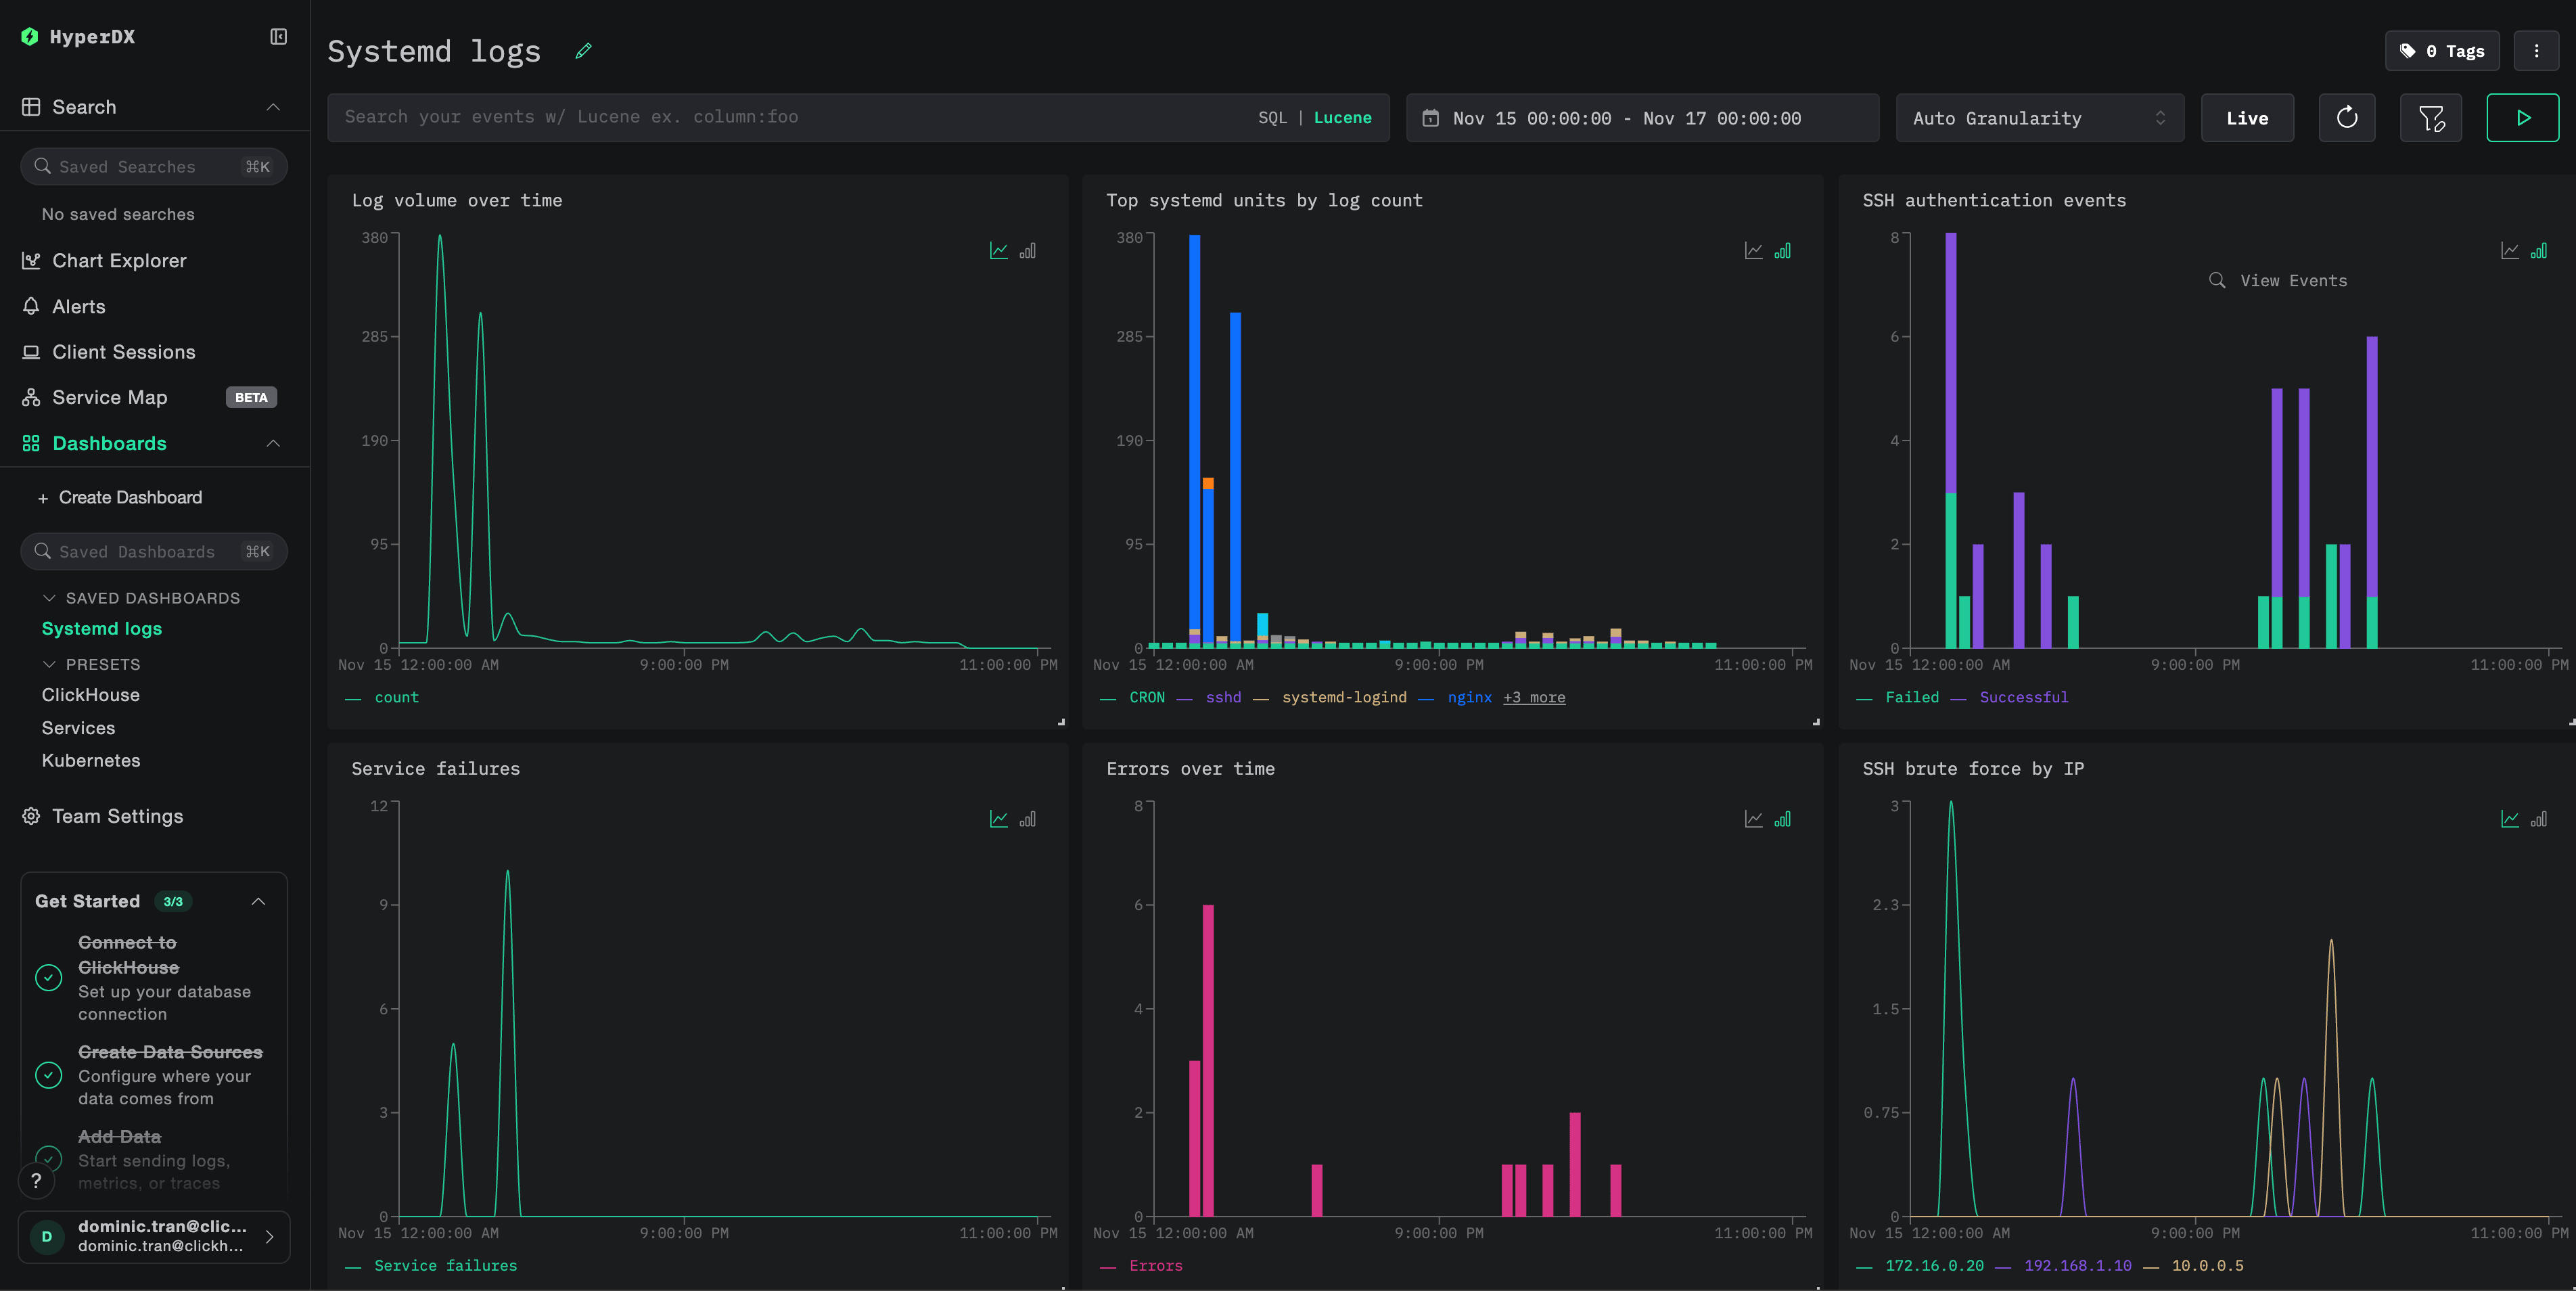
The dashboard includes visualizations for:
- Log volume over time
- Top systemd units by log count
- SSH authentication events
- Service failures
- Error rates
Troubleshooting
No logs appearing in HyperDX
Check if logs are reaching ClickHouse:
docker exec clickstack clickhouse-client --query "
SELECT COUNT(*) as log_count
FROM otel_logs
WHERE ServiceName = 'systemd-logs'
"
If no results, check the collector logs:
docker logs otel-collector | grep -i "error\|journald" | tail -20journalctl not found error
If you see exec: "journalctl": executable file not found in $PATH:
The otel/opentelemetry-collector-contrib image doesn’t include journalctl. You can either:
- Install the collector on the host:
wget https://github.com/open-telemetry/opentelemetry-collector-releases/releases/download/v0.115.0/otelcol-contrib_0.115.0_linux_amd64.tar.gz
tar -xzf otelcol-contrib_0.115.0_linux_amd64.tar.gz
sudo mv otelcol-contrib /usr/local/bin/
otelcol-contrib --config=otel-config.yaml- Use the text export approach (like the demo) with the
filelogreceiver reading journald exports
Next steps
- Set up alerts for critical system events (service failures, authentication failures, OOM kills)
- Create additional dashboards for specific use cases (SSH security monitoring, service health)
- Filter by specific systemd units to reduce noise and focus on services that matter
Going to production
This guide uses a separate OpenTelemetry Collector to read systemd logs and send them to ClickStack’s OTLP endpoint, which is the recommended production pattern.
For production environments with multiple hosts, consider:
- Deploying the collector as a DaemonSet in Kubernetes
- Running the collector as a systemd service on each host
- Using the OpenTelemetry Operator for automated deployment
See Ingesting with OpenTelemetry for production deployment patterns.